
Research · Quantitative and mixed methods
Big Data Research: Opportunities and Methodological Risks
What big data research is, the opportunities it creates for measurement, prediction and discovery, and the methodological risks it carries, including unrepresentative data, the big data paradox, algorithmic confounding, spurious patterns, causal inference and ethics.
Every search, purchase, card payment, phone call, sensor reading and social media post leaves a digital record. Together these records form big data: datasets so large, fast-moving or varied that they differ in kind from the data researchers traditionally collected. Big data has made it possible to measure human behaviour at a scale and speed that surveys and experiments cannot match. It has also produced some spectacular failures. This article explains what big data research offers, where its methodological risks lie and how to use it well.
What makes data "big"
Laney (2001) described data management challenges in terms of three dimensions that later became known as the three Vs: volume, the sheer quantity of data; velocity, the speed at which data are generated and must be processed; and variety, the range of formats, from structured tables to text, images and location traces. Others have added further Vs, such as veracity and value, but the original three capture the core.
Kitchin (2014) argued that big data is distinctive not only in scale but in being exhaustive in scope, often aiming to capture entire populations; fine-grained in resolution; relational, allowing records to be linked; and flexible, so that new fields can be added. Mayer-Schönberger and Cukier (2013) claimed that big data would shift attention from samples to entire populations, from exactness to messiness, and from causation to correlation.
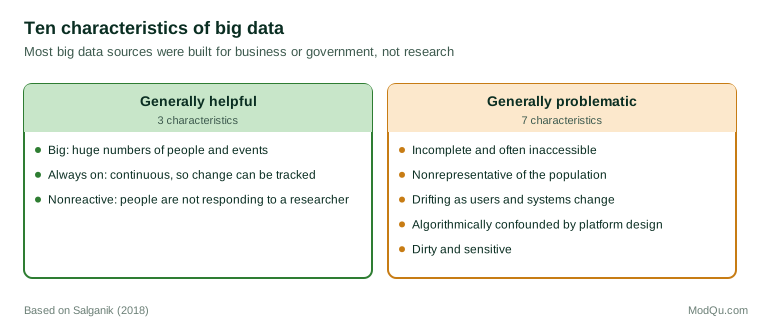
Salganik (2018) offered a more practical description for social researchers. He noted that most big data sources were created for purposes other than research, such as running a business or a government service, and described ten common characteristics. Three are generally helpful: such data are big, always on and nonreactive, meaning people do not change their behaviour because they know researchers are watching. Seven are generally problematic: the data are often incomplete, inaccessible, nonrepresentative, drifting over time, algorithmically confounded, dirty and sensitive. The diagram below summarises these characteristics.
Opportunities
Measuring what was hard to measure
Big data can capture behaviour directly, rather than relying on what people report. Purchase records show what people buy; mobility data show where they go; web logs show what they read. Einav and Levin (2014) described how economists have used transaction data, tax records and online prices to measure economic activity in far greater detail than official statistics allow.
Administrative data are a particularly powerful form of big data. Connelly et al. (2016) argued that records from tax, health, education and welfare systems often cover whole populations over long periods, making them among the most valuable sources for social research. Chetty et al. (2014) used tax records for millions of American children and their parents to measure the chance that a child born into a low-income family would reach the top of the income distribution, and showed that this chance varied greatly between areas of the country. No survey could have produced such fine-grained estimates.
Nowcasting
Big data arrive quickly, while official statistics often appear weeks or months later. Nowcasting uses timely data to estimate current conditions. Choi and Varian (2012) showed that Google search data could improve short-term forecasts of indicators such as car sales, unemployment claims and travel, compared with models using only past values of those indicators.
Discovery and prediction
Machine learning methods can find patterns in large datasets that would be hard to detect otherwise. Varian (2014) described how techniques developed for prediction, such as classification trees and regularised regression, can help economists handle large numbers of variables and complex relationships. In business, prediction from large datasets underlies recommendation systems, fraud detection and demand forecasting.
Experiments at scale
Digital platforms allow experiments on very large samples. Kramer et al. (2014) altered the news feeds of nearly 700,000 Facebook users to test whether exposure to positive or negative posts affected the emotional tone of users' own posts. They reported small effects consistent with emotional contagion. The study also became a landmark case in the ethics of big data research, discussed below.
The case of Google Flu Trends
The best-known cautionary tale is Google Flu Trends. Ginsberg et al. (2009) reported that search queries about influenza could be used to estimate influenza activity in the United States about one to two weeks ahead of official surveillance reports. The method was widely celebrated. But in later years it repeatedly overestimated flu prevalence, at one point predicting more than double the proportion of doctor visits for influenza-like illness reported by the Centers for Disease Control and Prevention.
Lazer et al. (2014) analysed the failure and identified two main causes. The first was big data hubris, the assumption that big data could replace rather than supplement traditional data collection and analysis. The original model had been fitted by searching among millions of search terms for those that tracked flu data, which risked picking terms that matched by coincidence. The second was algorithm dynamics: Google continually changed its search engine, for example by suggesting related searches, which changed the very behaviour the model relied on. The data were being shaped by the platform, not only by users' interest in flu.
Methodological risks
Unrepresentative data
Big data are usually not random samples of any population. Social media users differ from the population at large in age, education, location and interests, and active posters differ from passive users. Hargittai (2015) showed that people who use particular social network sites differ systematically in socioeconomic status and internet skills, so findings from one platform may not generalise to the population or even to users of other platforms. Tufekci (2014) described further problems, such as the dominance of a single platform in research, the selection of data by hashtag, which captures only users who adopt it, and the difficulty of knowing who did not post.
The big data paradox
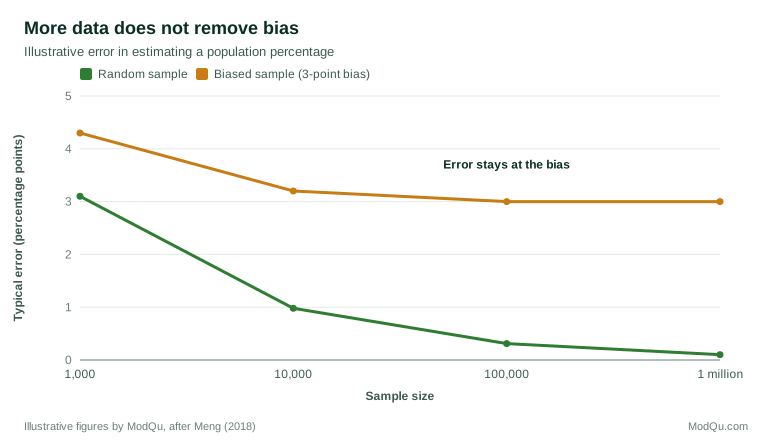
It is tempting to believe that a very large sample must give accurate results. Meng (2018) showed why this is not so. The error of an estimate from a non-random sample depends on three things: the quality of the data (how strongly being in the sample is related to the quantity being measured), the quantity of the data (what fraction of the population is included), and the difficulty of the problem (how variable the quantity is). Even a very small correlation between inclusion and the outcome can produce large errors, and the error does not shrink as the sample grows in the way it would for a random sample. Meng described this as the big data paradox: the more data, the surer we become of a biased answer. He estimated that, in the 2016 United States presidential election, a self-reported sample covering about 1 percent of voters but with a small selection bias had the effective accuracy of a simple random sample of only a few hundred people.
The chart below illustrates the idea with invented figures.
Groves (2011) placed this in the history of survey research, arguing that "organic" data generated by digital systems would complement rather than replace designed surveys, because surveys can measure things that digital traces miss and can be designed to represent a population.
Algorithmic confounding
Data generated on platforms reflect the design of the platform as well as the behaviour of users. Recommendation systems shape what people see and therefore what they click; interface changes alter how people search. Salganik (2018) called this algorithmic confounding. It means that patterns in the data may reveal more about the platform's engineering than about human behaviour, and that patterns may change when the platform changes, as happened with Google Flu Trends.
Drift
The population of users, the way they use a platform and the platform itself all change over time. A measure that worked last year may not work this year. Ruths and Pfeffer (2014) warned that studies of social media often failed to account for changes in platform design, user populations and the data made available to researchers, and that results could not easily be compared over time or across platforms.
Spurious patterns and statistical significance
With enough data, almost any difference is statistically significant. Lin et al. (2013) showed that in very large samples, p-values quickly approach zero even for trivially small effects, so significance tests become uninformative. They recommended reporting effect sizes and confidence intervals and judging practical importance. With many variables, the number of possible correlations is vast, and some will be strong by chance. Searching large datasets for patterns without theory or validation risks finding relationships that do not hold in new data.
Correlation and causation
Anderson (2008) famously argued that with enough data, "the numbers speak for themselves", and that correlation would make the scientific method obsolete. Most methodologists disagree. Kitchin (2014) argued that big data does not remove the need for theory, because decisions about what data to collect, how to analyse them and how to interpret results all depend on assumptions. Pearl and Mackenzie (2018) argued that data alone, however large, cannot answer causal questions such as what would happen if a policy changed; answering them requires a model of how variables influence one another. Large observational datasets are subject to the same confounding as small ones; size reduces random error but not bias.
Access and reproducibility
Much big data is held privately by companies, which decide who may use it and on what terms. boyd and Crawford (2012) warned that this creates a divide between researchers with privileged access, often those working with or for the companies, and those without it. Findings based on private data are hard for others to check, because the data cannot be shared and the platform may change before anyone tries. Ruths and Pfeffer (2014) noted that the samples platforms provide through their public interfaces are not always random and that their composition is often undocumented. Researchers should report exactly how data were obtained, what filters were applied and when, and should treat results that cannot be checked with appropriate caution.
Bias and fairness
When big data are used to make decisions about people, their biases can cause harm. Obermeyer et al. (2019) studied an algorithm widely used in American hospitals to identify patients who needed extra care. The algorithm used past health care costs as a measure of health need. Because less money had historically been spent on Black patients with the same level of need, the algorithm judged them to be healthier than equally sick White patients. The bias came not from the algorithm's code but from the choice of what to predict. O'Neil (2016) described many similar cases in which models trained on historical data reproduced and amplified existing inequalities, while appearing objective.
Skills and teams
Big data research usually needs a mix of skills that few individuals hold. Handling very large datasets requires programming, database and computing skills. Analysing them requires statistical knowledge, including an understanding of sampling, bias and causal inference that is sometimes missing from purely technical training. Interpreting them requires knowledge of the subject and context: an analyst who does not understand how a hospital records costs, or how a platform ranks posts, will misread the data. Einav and Levin (2014) noted that the most productive work in economics has come from combining domain questions with new data and methods, rather than from data alone. For organisations, this means that investment in data infrastructure should be matched by investment in people who can ask good questions of the data and recognise its limits.
Ethics
boyd and Crawford (2012) raised several critical questions about big data. They argued that big data changes the definition of knowledge, that claims to objectivity are misleading, that bigger data are not always better data, that data taken out of context lose meaning, that public availability does not make research ethical, and that limited access to big data creates new divides between researchers.
Privacy is a central concern. Narayanan and Shmatikov (2008) showed that individuals in an anonymised dataset of film ratings could be re-identified by matching their ratings with public reviews. Rich behavioural data are especially hard to anonymise, because patterns of behaviour are often unique to a person. Consent is also an issue. The study by Kramer et al. (2014) was conducted under the platform's terms of service, but many critics argued that users had not given informed consent to an experiment designed to alter their emotions.
Combining big data with designed data
Big data and traditional designed data have opposite strengths. Surveys and experiments are designed to answer specific questions and to represent a defined population, but they are slow, costly and limited in size. Digital traces are fast, cheap and huge, but they were not designed for research and rarely represent a population. Groves (2011) argued that the future of social measurement lies in combining the two. Salganik (2018) described several ways of doing so. In enriched asking, survey responses are linked to digital records for the same people, so that the survey supplies what the records lack, such as attitudes, and the records supply what the survey lacks, such as precise behaviour. In amplified asking, a survey of a small sample is used to train a model that predicts the same answers from digital traces for a much larger population. Choi and Varian (2012) showed a simpler combination: search data improved forecasts when added to conventional models, rather than replacing them. In each case, the designed data provide a benchmark against which the big data can be checked and corrected.
Questions to ask of a big data source
Before relying on a big data source, researchers can ask a short set of questions:
- Who generated these data, for what purpose, and what does the system record or ignore?
- Who is included, who is missing, and how do they differ from the population of interest?
- Has the platform, the user base or the recording method changed during the period studied?
- How might the platform's design have shaped the behaviour recorded?
- Can the data be checked against an independent source, such as a survey or official statistics?
- What would count as a meaningful effect, given that almost everything will be statistically significant?
- Could the analysis or its use harm the people in the data, or groups like them?
Using big data well
Several practices help researchers gain the benefits of big data while managing its risks:
- Start with a question, not with the data. Theory and context should guide what is measured and how results are interpreted.
- Understand how the data were generated, including who is included, what the platform records and how it has changed.
- Combine big data with designed data, such as surveys or experiments, which can correct for gaps and biases. Salganik (2018) described ways of linking surveys to digital trace data so that each strengthens the other.
- Validate findings on new data and over time, and be alert to drift.
- Focus on effect sizes and practical importance, not statistical significance.
- Be cautious about causal claims, using designs suited to causal inference where possible.
- Check for bias in what is predicted and in how predictions affect different groups.
- Protect privacy and consider the reasonable expectations of the people in the data.
An applied example
A hypothetical example: a retailer wants to estimate demand for a new product category across regions. It has millions of online browsing records. A naive analysis counts product views by region and scales them to the population. A careful analysis recognises that online shoppers differ by age and income from in-store shoppers, that a recent website redesign changed how often the category was displayed, and that views are not purchases. The team compares browsing data with sales data from a pilot region, weights the browsing data to match the population using census figures, and adjusts for the redesign. The resulting estimates are less dramatic than the naive ones but much closer to subsequent sales. The illustration shows that the value of big data depends on the work done to understand and correct it.
Conclusion
Big data offers new ways to measure behaviour, estimate current conditions, discover patterns and run experiments at scale. Its risks are equally real: unrepresentative samples, errors that do not shrink with size, platforms that shape the data they record, spurious patterns and biases that can harm people. The lesson from both its successes and failures is that big data does not replace careful research design. It needs theory, an understanding of how data were produced, validation and ethical care, as much as any other source of evidence.
References
Anderson, C. (2008, June 23). The end of theory: The data deluge makes the scientific method obsolete. Wired. https://www.wired.com/2008/06/pb-theory/
boyd, d., & Crawford, K. (2012). Critical questions for big data: Provocations for a cultural, technological, and scholarly phenomenon. Information, Communication & Society, 15(5), 662–679. https://doi.org/10.1080/1369118X.2012.678878
Chetty, R., Hendren, N., Kline, P., & Saez, E. (2014). Where is the land of opportunity? The geography of intergenerational mobility in the United States. The Quarterly Journal of Economics, 129(4), 1553–1623. https://doi.org/10.1093/qje/qju022
Choi, H., & Varian, H. (2012). Predicting the present with Google Trends. Economic Record, 88(s1), 2–9. https://doi.org/10.1111/j.1475-4932.2012.00809.x
Connelly, R., Playford, C. J., Gayle, V., & Dibben, C. (2016). The role of administrative data in the big data revolution in social science research. Social Science Research, 59, 1–12. https://doi.org/10.1016/j.ssresearch.2016.04.015
Einav, L., & Levin, J. (2014). Economics in the age of big data. Science, 346(6210), Article 1243089. https://doi.org/10.1126/science.1243089
Ginsberg, J., Mohebbi, M. H., Patel, R. S., Brammer, L., Smolinski, M. S., & Brilliant, L. (2009). Detecting influenza epidemics using search engine query data. Nature, 457(7232), 1012–1014. https://doi.org/10.1038/nature07634
Groves, R. M. (2011). Three eras of survey research. Public Opinion Quarterly, 75(5), 861–871. https://doi.org/10.1093/poq/nfr057
Hargittai, E. (2015). Is bigger always better? Potential biases of big data derived from social network sites. The Annals of the American Academy of Political and Social Science, 659(1), 63–76. https://doi.org/10.1177/0002716215570866
Kitchin, R. (2014). Big Data, new epistemologies and paradigm shifts. Big Data & Society, 1(1). https://doi.org/10.1177/2053951714528481
Kramer, A. D. I., Guillory, J. E., & Hancock, J. T. (2014). Experimental evidence of massive-scale emotional contagion through social networks. Proceedings of the National Academy of Sciences, 111(24), 8788–8790. https://doi.org/10.1073/pnas.1320040111
Laney, D. (2001). 3D data management: Controlling data volume, velocity, and variety (Application Delivery Strategies, File 949). META Group.
Lazer, D., Kennedy, R., King, G., & Vespignani, A. (2014). The parable of Google Flu: Traps in big data analysis. Science, 343(6176), 1203–1205. https://doi.org/10.1126/science.1248506
Lin, M., Lucas, H. C., Jr., & Shmueli, G. (2013). Too big to fail: Large samples and the p-value problem. Information Systems Research, 24(4), 906–917. https://doi.org/10.1287/isre.2013.0480
Mayer-Schönberger, V., & Cukier, K. (2013). Big data: A revolution that will transform how we live, work, and think. Houghton Mifflin Harcourt.
Meng, X.-L. (2018). Statistical paradises and paradoxes in big data (I): Law of large populations, big data paradox, and the 2016 US presidential election. The Annals of Applied Statistics, 12(2), 685–726. https://doi.org/10.1214/18-AOAS1161SF
Narayanan, A., & Shmatikov, V. (2008). Robust de-anonymization of large sparse datasets. In 2008 IEEE Symposium on Security and Privacy (pp. 111–125). IEEE. https://doi.org/10.1109/SP.2008.33
Obermeyer, Z., Powers, B., Vogeli, C., & Mullainathan, S. (2019). Dissecting racial bias in an algorithm used to manage the health of populations. Science, 366(6464), 447–453. https://doi.org/10.1126/science.aax2342
O'Neil, C. (2016). Weapons of math destruction: How big data increases inequality and threatens democracy. Crown.
Pearl, J., & Mackenzie, D. (2018). The book of why: The new science of cause and effect. Basic Books.
Ruths, D., & Pfeffer, J. (2014). Social media for large studies of behavior. Science, 346(6213), 1063–1064. https://doi.org/10.1126/science.346.6213.1063
Salganik, M. J. (2018). Bit by bit: Social research in the digital age. Princeton University Press.
Tufekci, Z. (2014). Big questions for social media big data: Representativeness, validity and other methodological pitfalls. In Proceedings of the Eighth International AAAI Conference on Weblogs and Social Media (pp. 505–514). AAAI Press.
Varian, H. R. (2014). Big data: New tricks for econometrics. Journal of Economic Perspectives, 28(2), 3–28. https://doi.org/10.1257/jep.28.2.3