
Investigation · Market and consumer investigation
Investigating Survey Anomalies and Unexpected Results
When a survey produces a surprising result, it may have found something new, or something may have gone wrong. This article sets out a structured way to investigate survey anomalies, from data processing errors and fraudulent responses to sampling problems and question effects, before concluding that the world has changed.
A survey result that nobody expected is either a discovery or a mistake. Customer satisfaction drops ten points in a month; support for a policy doubles; a minority group appears to behave very differently from everyone else; one region's answers look nothing like the rest. Sometimes the surprise is real and important. Often it is produced by something in the way the data were collected, processed or analysed. The task of the researcher is to find out which, and to do so before the result is reported, acted on or published.
This article treats an unexpected survey result as the starting point of an investigation. It describes the main sources of error that produce anomalies, a sequence for checking them, the techniques for detecting poor-quality and fraudulent responses, and the habits that prevent researchers from either dismissing real findings or accepting false ones.
Why surprises deserve scrutiny
Two errors are possible when a survey produces an unexpected result. The first is to accept it without checking, and to report a change that did not happen. The second is to dismiss it because it does not fit expectations, and to miss a real change. Both are common. Researchers, like other people, tend to search for evidence that supports what they already believe (Nickerson, 1998), which means that surprising results are sometimes checked far more thoroughly than expected ones. The aim of a good investigation is to apply the same scrutiny to every result, but to use surprises as a prompt to look harder.
The history of survey research includes many cases in which anomalies turned out to be errors. In 2015, a widely reported study in Science claiming that brief conversations with gay canvassers produced lasting changes in voters' attitudes was retracted after other researchers, trying to build on it, found irregularities in the data that suggested the survey had not been conducted as described (Broockman et al., 2015; McNutt, 2015). Inquiries into polling failures, such as the British general election of 2015 and the United States presidential election of 2016, found that systematic problems with samples, rather than late changes of mind, explained much of the error (Sturgis et al., 2016; Kennedy et al., 2018).
Where anomalies come from
The total survey error framework provides a map of where things can go wrong (Groves et al., 2009; Groves & Lyberg, 2010). Errors can arise in who is represented in the data and in how well the answers measure what they are meant to measure. Processing and analysis add further opportunities for error.
Processing and analysis errors
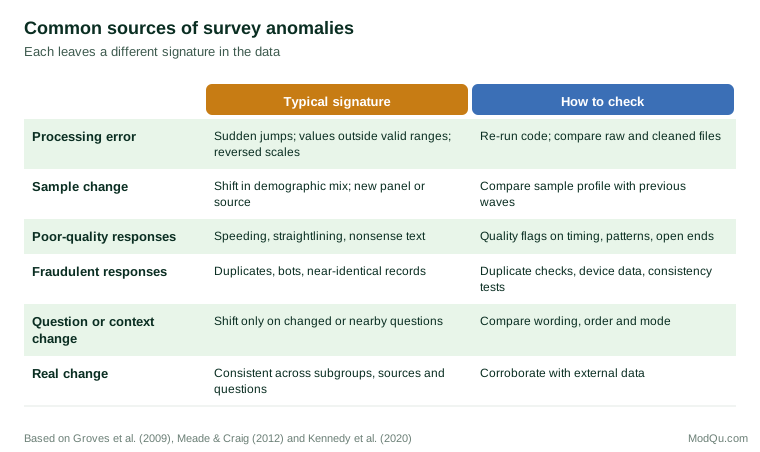
The most common cause of a surprising result is the simplest: a mistake in processing the data. A response scale coded in reverse, a filter applied to the wrong question, a weighting variable that failed to merge, a change in how missing values are treated or a formula copied into the wrong cell can each produce dramatic and entirely false results. These errors are often easy to find once someone looks, which is why checking processing should come first.
Changes in the sample
If the people who answered this time differ from those who answered last time, results can change even when nothing in the population has changed. A new online panel, a change in recruitment, a different mix of devices, or a fall in response rates among some groups can shift results. Comparing the demographic and behavioural profile of the sample with previous waves and with external benchmarks shows whether the sample itself has moved. Weighting can correct for some differences, but only for characteristics that are measured and only if the weighted groups are otherwise similar to the people they represent.
Poor-quality responses
Some respondents do not answer carefully. Krosnick (1991) described "satisficing", in which respondents give answers that are good enough to get through the survey rather than optimal, for example by choosing the first acceptable option or agreeing with every statement. Inattentive responding can shift averages and, more seriously, create spurious relationships between variables. Meade and Craig (2012) and Curran (2016) review methods for detecting careless responses, including very short completion times, identical answers across a grid of questions ("straightlining"), failure on attention-check items, inconsistent answers to related questions and meaningless text in open-ended answers.
Fraudulent responses
Online surveys that pay respondents attract fraud. Some respondents take surveys many times using different identities; others use automated programs. A study by the Pew Research Center found that online opt-in samples contained bogus respondents who answered in ways that could distort estimates, particularly for small groups and for questions where a bogus respondent's tendency to answer "yes" would inflate apparent rates of rare behaviours (Kennedy et al., 2020). In interviewer-administered surveys, the equivalent problem is interviewers who fabricate interviews. Statistical methods can identify suspicious interviewers by comparing patterns in their data with those of others (Bredl et al., 2012), and checks for near-duplicate records, in which most answers are identical across two respondents, can reveal copying (Kuriakose & Robbins, 2016).
Question and context effects
Small changes to wording, response options, the order of questions or the mode of administration can change answers substantially. Schuman and Presser (1981) documented many such effects in experiments embedded in surveys. Tourangeau et al. (2000) explain them in terms of the cognitive steps respondents go through: understanding the question, retrieving relevant information, forming a judgment and reporting it. A question placed after a series of questions about crime, for example, may produce different answers about neighbourhood satisfaction than the same question asked first. Sensitive questions are particularly affected by mode: people report more socially undesirable behaviour when answering privately on a screen than to an interviewer (Tourangeau & Yan, 2007).
A sequence for investigating an anomaly
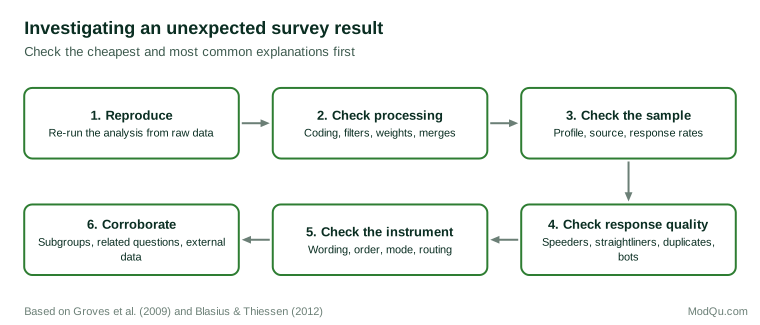
Reproduce the result. Before anything else, another person should reproduce the result from the raw data, using the documented procedure. Many anomalies disappear at this stage.
Check processing. Compare the raw and cleaned data. Check variable coding, scale direction, routing and filters, missing value treatment and weights. Compare unweighted and weighted results: if the anomaly appears only after weighting, the weights are a prime suspect.
Check the sample. Compare the sample profile with previous waves and with benchmarks. Look for changes in the source of respondents, the device mix, the time of fieldwork and response rates by group.
Check response quality. Apply quality flags for completion time, straightlining, attention checks, inconsistent answers and open-ended responses. Look for duplicate or near-duplicate records. Then recompute the result with and without flagged cases. If the anomaly is concentrated among flagged respondents, it is likely to be an artefact. Blasius and Thiessen (2012) describe further techniques for assessing data quality, such as examining whether respondents use response scales in meaningful ways.
Check the instrument. Compare the questionnaire with previous versions. Changes in wording, response options, question order or mode are frequent causes of apparent shifts.
Corroborate. If the result survives these checks, test whether it is consistent with other evidence. Does it appear across subgroups, or only in one? Do related questions move in the same direction? Do external sources, such as sales data, administrative records or other surveys, show a similar change? A real change usually leaves traces in more than one place.
Avoiding the opposite error
The checks described here can also be misused. If researchers apply them only to results they dislike, they will remove inconvenient findings and keep convenient ones. Simmons et al. (2011) showed how flexibility in decisions about data, such as which cases to exclude and which variables to analyse, can produce false positive findings, and Gelman and Loken (2014) described how such choices can be shaped by the data even without any intent to mislead. The protection is to set data quality rules in advance, apply them consistently to every survey and every result, and report how many cases were removed and why.
Missing data require similar care. Removing respondents with incomplete answers can bias results if the people who skip questions differ from those who answer them, and methods exist for handling missing data in ways that reduce this bias (Little & Rubin, 2019).
Reporting what was found
Whatever the outcome, the investigation should be documented and the relevant parts reported. If the anomaly was an error, users of the data need to know what was corrected and whether earlier results were affected. If it was a real change, they need to know what checks it passed, so that they can judge how much confidence to place in it. If the cause could not be established, the report should say so plainly and present the result with an appropriate warning rather than either suppressing it or presenting it as settled. A short methods note recording the checks carried out, the number of cases removed under each quality rule and any changes to the sample or questionnaire allows later waves to be compared fairly and makes the survey's record of quality visible to its users.
A short example
The following hypothetical case illustrates the process. A quarterly survey of small business owners shows that the share planning to hire in the next year has jumped from 22 to 35 per cent, a result that would make headlines. The research team reproduces the figure and confirms that the code is correct and the weights are unchanged. The sample profile, however, shows a rise in the share of respondents under thirty, and the panel provider confirms that a new recruitment source was added this quarter.
Quality checks show that respondents from the new source completed the survey in a median of four minutes, against nine minutes for others, and that a large share gave identical answers across every grid. Several hundred records share the same answers to all but a few questions. When flagged respondents are removed under the team's existing quality rules, the share planning to hire is 24 per cent, within the normal range. The team reports the corrected figure, notes the change in sample source and the quality problems found, and asks the provider to remove the new source.
Conclusion
A surprising survey result is a lead, not a finding. Investigating it means checking the most common and least interesting explanations first: processing errors, changes in the sample, poor-quality and fraudulent responses, and changes to the questionnaire. Only when these have been ruled out, and the result is supported by other evidence, should it be treated as a real change. Applying the same checks to every result, according to rules set in advance, ensures that the investigation protects the truth rather than the researcher's expectations.
References
Blasius, J., & Thiessen, V. (2012). Assessing the quality of survey data. Sage. https://doi.org/10.4135/9781446251874
Bredl, S., Winker, P., & Kötschau, K. (2012). A statistical approach to detect interviewer falsification of survey data. Survey Methodology, 38(1), 1–10.
Broockman, D., Kalla, J., & Aronow, P. (2015). Irregularities in LaCour (2014) [Unpublished report].
Curran, P. G. (2016). Methods for the detection of carelessly invalid responses in survey data. Journal of Experimental Social Psychology, 66, 4–19. https://doi.org/10.1016/j.jesp.2015.07.006
Gelman, A., & Loken, E. (2014). The statistical crisis in science. American Scientist, 102(6), 460–465. https://doi.org/10.1511/2014.111.460
Groves, R. M., Fowler, F. J., Jr., Couper, M. P., Lepkowski, J. M., Singer, E., & Tourangeau, R. (2009). Survey methodology (2nd ed.). Wiley.
Groves, R. M., & Lyberg, L. (2010). Total survey error: Past, present, and future. Public Opinion Quarterly, 74(5), 849–879. https://doi.org/10.1093/poq/nfq065
Kennedy, C., Blumenthal, M., Clement, S., Clinton, J. D., Durand, C., Franklin, C., McGeeney, K., Miringoff, L., Olson, K., Rivers, D., Saad, L., Witt, G. E., & Wlezien, C. (2018). An evaluation of the 2016 election polls in the United States. Public Opinion Quarterly, 82(1), 1–33. https://doi.org/10.1093/poq/nfx047
Kennedy, C., Hatley, N., Lau, A., Mercer, A., Keeter, S., Ferno, J., & Asare-Marfo, D. (2020). Assessing the risks to online polls from bogus respondents. Pew Research Center.
Krosnick, J. A. (1991). Response strategies for coping with the cognitive demands of attitude measures in surveys. Applied Cognitive Psychology, 5(3), 213–236. https://doi.org/10.1002/acp.2350050305
Kuriakose, N., & Robbins, M. (2016). Don't get duped: Fraud through duplication in public opinion surveys. Statistical Journal of the IAOS, 32(3), 283–291. https://doi.org/10.3233/SJI-160978
Little, R. J. A., & Rubin, D. B. (2019). Statistical analysis with missing data (3rd ed.). Wiley. https://doi.org/10.1002/9781119482260
McNutt, M. (2015). Editorial retraction. Science, 348(6239), 1100. https://doi.org/10.1126/science.aac6638
Meade, A. W., & Craig, S. B. (2012). Identifying careless responses in survey data. Psychological Methods, 17(3), 437–455. https://doi.org/10.1037/a0028085
Nickerson, R. S. (1998). Confirmation bias: A ubiquitous phenomenon in many guises. Review of General Psychology, 2(2), 175–220. https://doi.org/10.1037/1089-2680.2.2.175
Schuman, H., & Presser, S. (1981). Questions and answers in attitude surveys: Experiments on question form, wording, and context. Academic Press.
Simmons, J. P., Nelson, L. D., & Simonsohn, U. (2011). False-positive psychology: Undisclosed flexibility in data collection and analysis allows presenting anything as significant. Psychological Science, 22(11), 1359–1366. https://doi.org/10.1177/0956797611417632
Sturgis, P., Baker, N., Callegaro, M., Fisher, S., Green, J., Jennings, W., Kuha, J., Lauderdale, B., & Smith, P. (2016). Report of the inquiry into the 2015 British general election opinion polls. Market Research Society and British Polling Council.
Tourangeau, R., Rips, L. J., & Rasinski, K. (2000). The psychology of survey response. Cambridge University Press. https://doi.org/10.1017/CBO9780511819322
Tourangeau, R., & Yan, T. (2007). Sensitive questions in surveys. Psychological Bulletin, 133(5), 859–883. https://doi.org/10.1037/0033-2909.133.5.859