
Investigation · Market and consumer investigation
Investigating Data Quality Problems in Research
Research conclusions are only as good as the data behind them. This article explains the main kinds of data quality problem, from simple entry errors to fabrication, the checks that reveal them, and how to investigate a dataset before relying on it.
A research finding passes through many hands before it reaches a reader: the people who collected the data, those who entered and cleaned it, the analysts who processed it and the authors who reported it. At each step, errors can enter. Most are innocent: a mistyped value, a misaligned column, a formula that misses some rows. A few are deliberate. Whatever their cause, they can change conclusions, and they are rarely visible in a polished report. Investigating data quality means examining the data themselves, and how they were produced, before trusting what they appear to show.
What data quality means
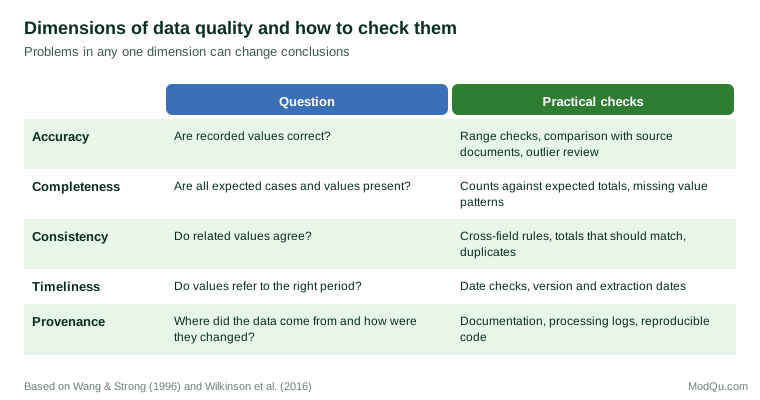
Data quality has several dimensions. Wang and Strong (1996), surveying people who use data, found that they judged quality not only by accuracy but also by whether data were complete, consistent, timely, relevant, interpretable and accessible. A dataset can be accurate in every recorded value and still mislead if important cases are missing or if variables are defined differently from what the user assumes.
Common kinds of problem
Entry and processing errors
Errors in spreadsheets are common and consequential. Panko (1998), reviewing studies of spreadsheet development, found that errors occurred in a large share of spreadsheets examined. A well-known case concerned an influential paper by Reinhart and Rogoff (2010) on public debt and economic growth. When Herndon et al. (2014) tried to reproduce the results using the authors' spreadsheet, they found a formula that omitted several countries, along with choices about weighting and excluded data; correcting these substantially weakened the reported relationship. Software can also introduce errors silently. Ziemann et al. (2016) found that about a fifth of papers with supplementary gene lists in leading journals contained errors caused by spreadsheet software automatically converting gene names into dates.
Broman and Woo (2018) set out practices that reduce such errors: consistent formats, one value per cell, no calculations in raw data files, a data dictionary, and keeping an untouched copy of the original data.
Reporting errors
Errors also occur between analysis and publication. Nuijten et al. (2016) used an automated tool to check statistical results reported in psychology articles and found that about half of the articles contained at least one inconsistency between a test statistic, its degrees of freedom and the reported p-value. Brown and Heathers (2017) described the GRIM test, a simple check of whether a reported mean is mathematically possible given the sample size and the fact that the underlying responses are whole numbers; applied to published papers, it revealed many impossible values.
Fabrication
Occasionally, data are invented. Fabricated data often have statistical properties that genuine data lack. Simonsohn (2013) showed how two cases of fabrication were detected because reported results across conditions were too similar to be plausible. Carlisle (2017) examined baseline variables in over five thousand randomised trials and identified trials whose distributions were inconsistent with random allocation, some of which were later found to involve fabrication. Such methods identify data that deserve closer scrutiny; they do not by themselves prove misconduct, since errors and unusual designs can produce similar patterns.
Data from third parties
Many research projects rely on data collected by others: purchased panels, administrative records, commercial databases or data obtained through software interfaces. These sources can change without notice. A supplier may alter a definition, fill gaps with estimates, or change how records are matched, and the user may see only a shift in results. Before relying on such data, investigators should ask the supplier how the data are produced, check a sample against independent sources, and monitor key figures over time for unexplained breaks.
Investigating a dataset
An investigation of data quality typically follows several steps.
Start with provenance. Find out how the data were collected, by whom, using what instruments, and what has been done to them since. Read the documentation and processing code. If neither exists, that is itself a finding.
Reproduce the key results. Re-run the analysis from the rawest available data. Discrepancies between the reproduced and reported results point to where errors may lie. Large-scale efforts to reproduce published findings have shown that many results are weaker than reported or cannot be confirmed (Open Science Collaboration, 2015).
Run systematic checks. Check that values fall within valid ranges, that categories are coded consistently, that totals add up, that identifiers are unique and that dates make sense. Examine distributions for unexpected spikes, gaps or heaping on round numbers. Look at patterns of missing data.
Examine outliers and anomalies. Unusual values may be errors or the most interesting part of the data. Each should be traced back to its source before it is corrected or removed, and any change should be recorded.
Look for signs of fabrication when warranted. Where results seem too clean, too consistent or too good, statistical checks for implausible patterns can be applied. Any concern should be raised through proper channels and with care, since an accusation of fabrication is serious and the evidence must be strong.
A short example
The following hypothetical case illustrates the process. An analyst preparing a report on regional employment notices that one region's average weekly hours rose sharply in the latest release. Reproducing the figure from the raw file confirms it. Range checks then show a small number of records with weekly hours above 150, all from one data collection site and all entered in the same week. The source forms show that these records were entered as monthly rather than weekly hours. Correcting them removes the rise. The analyst records the correction, informs the data supplier and adds a range check to the processing routine so that the same error would be caught automatically in future.
Building quality in
The most effective way to deal with data quality problems is to prevent them. Practices that help include writing a data management plan before collection begins, using validation rules at the point of entry, keeping raw data unchanged and doing all cleaning in documented, reproducible code, and recording every decision to correct or exclude data. The FAIR principles, which call for data to be findable, accessible, interoperable and reusable, encourage documentation and metadata that make quality easier to assess by others (Wilkinson et al., 2016).
Conclusion
Data quality problems are common, often invisible in published results, and sometimes large enough to reverse conclusions. Investigating them requires attention to how the data were produced, systematic checks of the values themselves, reproduction of key results and a willingness to trace anomalies back to their source. The same discipline that guides any investigation applies here: test the evidence before relying on it, and record what was found.
References
Broman, K. W., & Woo, K. H. (2018). Data organization in spreadsheets. The American Statistician, 72(1), 2–10. https://doi.org/10.1080/00031305.2017.1375989
Brown, N. J. L., & Heathers, J. A. J. (2017). The GRIM test: A simple technique detects numerous anomalies in the reporting of results in psychology. Social Psychological and Personality Science, 8(4), 363–369. https://doi.org/10.1177/1948550616673876
Carlisle, J. B. (2017). Data fabrication and other reasons for non-random sampling in 5087 randomised, controlled trials in anaesthetic and general medical journals. Anaesthesia, 72(8), 944–952. https://doi.org/10.1111/anae.13938
Herndon, T., Ash, M., & Pollin, R. (2014). Does high public debt consistently stifle economic growth? A critique of Reinhart and Rogoff. Cambridge Journal of Economics, 38(2), 257–279. https://doi.org/10.1093/cje/bet075
Nuijten, M. B., Hartgerink, C. H. J., van Assen, M. A. L. M., Epskamp, S., & Wicherts, J. M. (2016). The prevalence of statistical reporting errors in psychology (1985–2013). Behavior Research Methods, 48(4), 1205–1226. https://doi.org/10.3758/s13428-015-0664-2
Open Science Collaboration. (2015). Estimating the reproducibility of psychological science. Science, 349(6251), Article aac4716. https://doi.org/10.1126/science.aac4716
Panko, R. R. (1998). What we know about spreadsheet errors. Journal of End User Computing, 10(2), 15–21. https://doi.org/10.4018/joeuc.1998040102
Reinhart, C. M., & Rogoff, K. S. (2010). Growth in a time of debt. American Economic Review, 100(2), 573–578. https://doi.org/10.1257/aer.100.2.573
Simonsohn, U. (2013). Just post it: The lesson from two cases of fabricated data detected by statistics alone. Psychological Science, 24(10), 1875–1888. https://doi.org/10.1177/0956797613480366
Wang, R. Y., & Strong, D. M. (1996). Beyond accuracy: What data quality means to data consumers. Journal of Management Information Systems, 12(4), 5–33. https://doi.org/10.1080/07421222.1996.11518099
Wilkinson, M. D., Dumontier, M., Aalbersberg, I. J., Appleton, G., Axton, M., Baak, A., Blomberg, N., Boiten, J.-W., da Silva Santos, L. B., Bourne, P. E., Bouwman, J., Brookes, A. J., Clark, T., Crosas, M., Dillo, I., Dumon, O., Edmunds, S., Evelo, C. T., Finkers, R., … Mons, B. (2016). The FAIR guiding principles for scientific data management and stewardship. Scientific Data, 3, Article 160018. https://doi.org/10.1038/sdata.2016.18
Ziemann, M., Eren, Y., & El-Osta, A. (2016). Gene name errors are widespread in the scientific literature. Genome Biology, 17, Article 177. https://doi.org/10.1186/s13059-016-1044-7