
Investigation · Market and consumer investigation
Investigating Declining Sales: A Diagnostic Approach
When sales fall, the first explanation offered is often wrong. This article sets out a diagnostic approach to investigating a sales decline: confirming that the decline is real, breaking it into its components, testing rival explanations and avoiding the statistical traps that lead to the wrong conclusion.
Falling sales produce urgent meetings and quick explanations. The sales team blames pricing, marketing blames the product, finance blames the economy, and someone points to a new competitor. Each explanation may be partly true, but decisions made on the first plausible story can make things worse: cutting prices when the real problem is availability, or launching a campaign when existing customers are leaving because of poor service. Investigating a sales decline means treating it as a problem to be diagnosed, with the same discipline as any other investigation.
This article sets out a diagnostic approach in four stages: confirm the decline, decompose it, generate and test explanations, and act on the evidence.
Stage one: confirm that the decline is real
The first question is whether sales have actually fallen, and by how much, once normal variation is taken into account. Many apparent declines are artefacts of comparison.
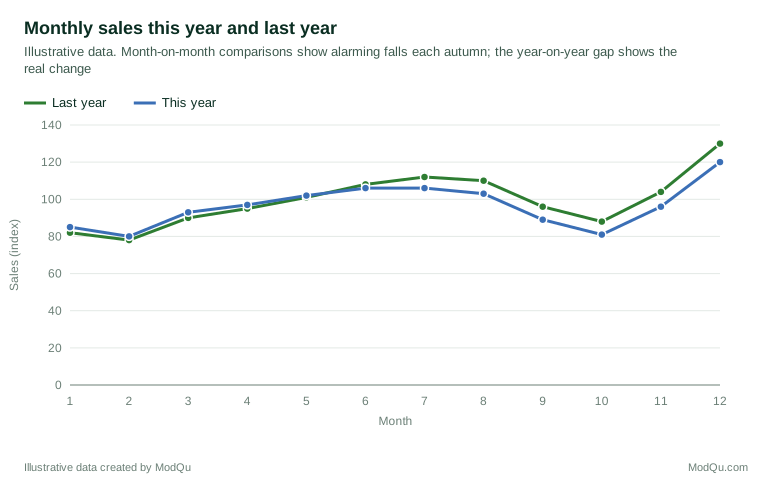
Seasonality. Comparing this month with last month will show a fall whenever the business moves from a strong season to a weak one. Comparing with the same period last year removes most seasonal effects. Statistical methods can separate a series into trend, seasonal and irregular components, so that the underlying trend can be seen (Cleveland et al., 1990; Hyndman & Athanasopoulos, 2021).
Calendar and timing effects. The number of trading days, the timing of holidays, and shifts in when large orders are placed can all create apparent changes. A month with one fewer weekend may show lower retail sales for no other reason.
Measurement changes. Changes to how sales are recorded, such as a new system, a change in when returns are deducted, or reclassification of products, can produce declines that exist only in the data. Investigators should check whether anything changed in how the figures are produced before searching for causes in the market.
Normal variation. Sales fluctuate. A decline should be judged against the usual range of variation, not against a single comparison point.
Stage two: decompose the decline
Total sales are the product of several components, and a decline must come from one or more of them. Breaking sales into components narrows the search for causes. Research on repeat buying has shown that sales can be described usefully in terms of how many people buy and how often they buy (Ehrenberg, 1988), and work on customer value treats revenue as the result of acquiring customers, retaining them and the margin earned on each (Gupta et al., 2004).
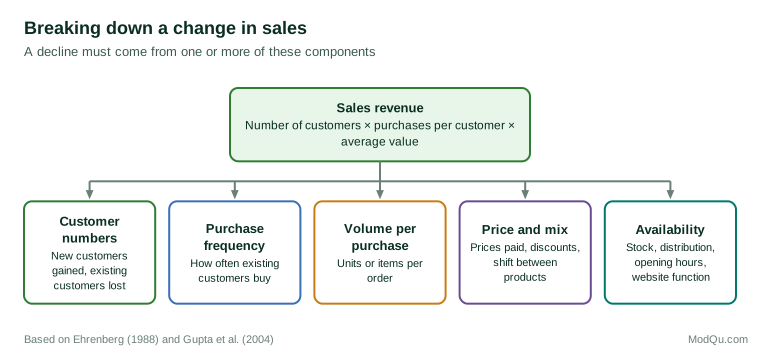
Each component points to a different set of causes. A fall in customer numbers may result from losing existing customers or failing to attract new ones. Research on brand buying has found that brands with smaller market shares typically have both fewer buyers and slightly lower loyalty among those buyers, a pattern known as double jeopardy (Ehrenberg et al., 1990). Sharp (2010) argues from this evidence that most changes in a brand's sales come from changes in the number of buyers, especially light buyers, rather than from changes in how loyal existing buyers are. This suggests that investigators should look first at whether the business is reaching as many buyers as before. Where customers buy repeatedly, models of the customer base can estimate from purchase histories how many customers are still active and how many have quietly lapsed (Fader et al., 2005). Losing existing customers is usually expensive, because retained customers tend to buy more over time and cost less to serve (Reichheld & Sasser, 1990).
A fall in purchase frequency points to changes in customers' needs or to competition for their spending. A fall in average value may reflect discounting or a shift towards cheaper products. Problems with availability, such as stock shortages or a website fault, can reduce sales even when demand is unchanged.
The decline should also be broken down by segment: product, region, channel, customer type and store. A decline concentrated in one region or one product line points to local causes; a decline spread evenly across all segments points to something general, such as the economy or a change in the overall market.
Stage three: generate and test explanations
List the rival explanations
With the decline confirmed and located, the investigator lists possible explanations. These typically include changes in the market (economic conditions, demand for the category), changes in competition (new entrants, competitors' prices and promotions), changes made by the business itself (prices, product changes, marketing, staffing, systems), and external events (weather, regulation, publicity). Some declines have slower, structural causes: Christensen (1997) showed how established firms can lose customers to products that at first seem inferior but serve needs the incumbents have overlooked. Listing them explicitly guards against settling on the first plausible story, a risk made greater by the tendency to seek evidence that confirms an existing belief (Nickerson, 1998). Heuer (1999) recommends assessing evidence against all competing hypotheses at once, and asking which evidence is inconsistent with each, since evidence that fits every explanation does not help to choose between them.
Test against the evidence
Each explanation implies something about where and when the decline should appear. If a competitor's new store is responsible, the decline should be concentrated near that store and should start when it opened. If a price increase is responsible, sales of the affected products should fall more than others, and the timing should match. If the economy is responsible, competitors and the wider category should be declining too. Comparing the pattern of the decline with these predictions is the core of the diagnosis. Where several changes happened at once, statistical market response models can estimate how sales respond to price, promotion, advertising and distribution over time, and help to separate their effects (Hanssens et al., 2001).
Beware aggregation traps
Aggregated figures can mislead. Simpson (1951) described how a relationship that holds within every subgroup can reverse when the groups are combined. A well-known example concerned graduate admissions at the University of California, Berkeley: overall figures appeared to show that women were admitted at a lower rate than men, but within most departments the difference disappeared or reversed, because women had applied in greater numbers to departments with low admission rates (Bickel et al., 1975). In sales, the same effect can appear when the mix of products, stores or customers changes. Average sales per store can fall even though every individual store is doing better, if new, smaller stores have been added. Examining components and segments separately protects against this trap.
Use experiments where possible
Where the cause is uncertain and the stakes are high, a controlled test may settle the question. A business can restore a previous price in some stores and not others, or reverse a website change for a random sample of visitors, and compare the results. Well-designed experiments provide much stronger evidence of cause than comparisons of historical data (Kohavi et al., 2020).
Stage four: act and monitor
The diagnosis should lead to action targeted at the confirmed cause, and the effect of that action should be monitored. If sales recover after the fix, the diagnosis is supported; if they do not, the investigation should be reopened. Investigators should also guard against the opposite error: attributing a natural recovery to an intervention that coincided with it.
A short example
The following hypothetical case illustrates the approach. A chain of garden centres sees revenue fall 8 per cent year on year over the summer. Managers blame wet weather. Decomposition shows that the number of transactions is down 12 per cent, while average spend per visit is up. The fall is concentrated in eight of thirty stores, and in those stores it began in the same week. The weather explanation does not fit: it would affect all stores, and competitors in the same areas report normal trading. The eight stores turn out to share a new booking system for click-and-collect orders, introduced that week, which frequently showed products as out of stock when they were not. Fixing the system restores transactions within a month.
Conclusion
A sales decline is a symptom with many possible causes. Investigating it well means confirming that the decline is real, breaking it into components and segments, listing rival explanations, testing each against the pattern of the evidence, and avoiding the statistical traps that make aggregate figures misleading. The first explanation offered is often the one that is most familiar, not the one that is true. A diagnostic approach finds the cause that the evidence supports, and so leads to actions that actually work.
References
Bickel, P. J., Hammel, E. A., & O'Connell, J. W. (1975). Sex bias in graduate admissions: Data from Berkeley. Science, 187(4175), 398–404. https://doi.org/10.1126/science.187.4175.398
Christensen, C. M. (1997). The innovator's dilemma: When new technologies cause great firms to fail. Harvard Business School Press.
Cleveland, R. B., Cleveland, W. S., McRae, J. E., & Terpenning, I. (1990). STL: A seasonal-trend decomposition procedure based on loess. Journal of Official Statistics, 6(1), 3–73.
Ehrenberg, A. S. C., Goodhardt, G. J., & Barwise, T. P. (1990). Double jeopardy revisited. Journal of Marketing, 54(3), 82–91. https://doi.org/10.1177/002224299005400307
Ehrenberg, A. S. C. (1988). Repeat-buying: Facts, theory and applications (2nd ed.). Charles Griffin.
Fader, P. S., Hardie, B. G. S., & Lee, K. L. (2005). "Counting your customers" the easy way: An alternative to the Pareto/NBD model. Marketing Science, 24(2), 275–284. https://doi.org/10.1287/mksc.1040.0098
Gupta, S., Lehmann, D. R., & Stuart, J. A. (2004). Valuing customers. Journal of Marketing Research, 41(1), 7–18. https://doi.org/10.1509/jmkr.41.1.7.25084
Hanssens, D. M., Parsons, L. J., & Schultz, R. L. (2001). Market response models: Econometric and time series analysis (2nd ed.). Kluwer Academic.
Heuer, R. J., Jr. (1999). Psychology of intelligence analysis. Center for the Study of Intelligence, Central Intelligence Agency.
Hyndman, R. J., & Athanasopoulos, G. (2021). Forecasting: Principles and practice (3rd ed.). OTexts.
Kohavi, R., Tang, D., & Xu, Y. (2020). Trustworthy online controlled experiments: A practical guide to A/B testing. Cambridge University Press. https://doi.org/10.1017/9781108653985
Nickerson, R. S. (1998). Confirmation bias: A ubiquitous phenomenon in many guises. Review of General Psychology, 2(2), 175–220. https://doi.org/10.1037/1089-2680.2.2.175
Reichheld, F. F., & Sasser, W. E., Jr. (1990). Zero defections: Quality comes to services. Harvard Business Review, 68(5), 105–111.
Sharp, B. (2010). How brands grow: What marketers don't know. Oxford University Press.
Simpson, E. H. (1951). The interpretation of interaction in contingency tables. Journal of the Royal Statistical Society: Series B (Methodological), 13(2), 238–241. https://doi.org/10.1111/j.2517-6161.1951.tb00088.x