
Investigation · Journalism and public investigation
Data Journalism: Investigating With Numbers
Data journalism uses the analysis of datasets to find and tell stories that would otherwise remain hidden. This article explains its origins, how data investigations are carried out, the statistical pitfalls that catch reporters out, and what makes data journalism trustworthy and valuable.
Some patterns cannot be seen in any single document or interview. A bank's refusal of one mortgage application tells little; the refusal rates for thousands of applications, broken down by neighbourhood, can reveal discrimination. One police shooting is a tragedy; records of every shooting over a decade can show whether some groups are affected far more than others. Data journalism is the practice of finding, analysing and presenting such patterns in data so that the public can understand them.
Data journalism has become a standard part of investigative reporting. It is used to test official claims, to find stories hidden in public records, to measure the scale of problems that individual cases only hint at, and to hold institutions accountable for what their own data show. This article explains where data journalism came from, how data investigations are carried out, the common errors that reporters must avoid, and what the research says about its value.
Origins
Using numbers in journalism is not new, but systematic analysis of data began in the 1960s. Philip Meyer, a reporter for the Detroit Free Press, used survey methods to study the causes of the 1967 Detroit riots. His survey of residents challenged the popular belief that rioters were mainly recent migrants from the South or the least educated; in fact, people raised in the North were more likely to have taken part. Meyer (2002) later set out the case for "precision journalism", arguing that journalists should adopt the methods of social science, including sampling, statistical analysis and hypothesis testing, to report more accurately on society.
During the 1970s and 1980s, a growing number of reporters used computers to analyse government records, a practice that became known as computer-assisted reporting. One landmark was "The Color of Money", a 1988 series in The Atlanta Journal-Constitution by Bill Dedman, which analysed federal records of home loans and showed that banks lent far more in white neighbourhoods than in Black neighbourhoods with similar incomes (Dedman, 1988). The series won a Pulitzer Prize and led to changes in lending practices and enforcement. Houston (2010) describes how such work spread through newsrooms as computing became cheaper and more data became available in electronic form.
The term "data journalism" became common around 2010, as open data initiatives, the internet and new tools for analysis and visualisation made data more accessible. Gray et al. (2012) brought together practitioners from many countries in the first Data Journalism Handbook, and a later volume reflected on the field's development and its critical questions (Bounegru & Gray, 2021).
What counts as data journalism
Coddington (2015) distinguishes three related practices. Computer-assisted reporting is the older tradition of investigative analysis of public records, often using social science methods. Data journalism is broader, including the publication of data and interactive visualisations, and is often associated with openness and audience participation. Computational journalism applies programming and algorithmic methods, such as automated text analysis, to reporting. In practice, the three overlap, and many projects combine elements of each.
Studies of newsrooms show that data journalism varies widely in practice. Fink and Anderson (2015) found that in the United States, data journalism was concentrated in a small number of large and well-resourced organisations, while many smaller newsrooms had limited capacity. Appelgren and Nygren (2014) found that Swedish newsrooms introducing data journalism faced challenges of skills, time and organisational culture. Borges-Rey (2016) found that British data journalists combined journalistic and technical skills and described their work as closely linked to the investigative tradition.
How data investigations are done
Bradshaw (2011) describes data journalism as a sequence of stages: compiling the data, cleaning it, placing it in context, combining it with other data, and communicating the results. Each stage involves choices that affect the conclusions.
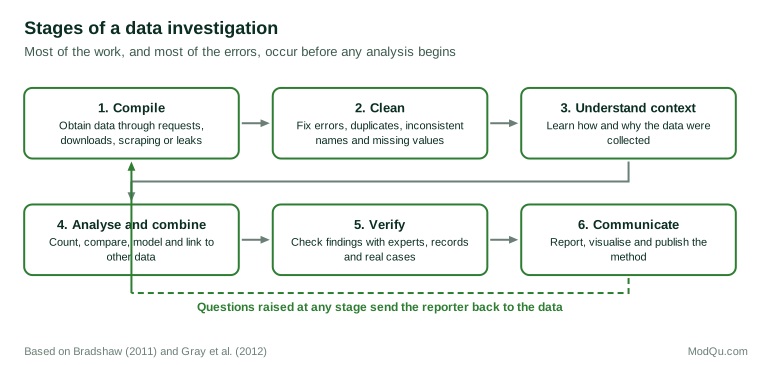
Compiling data. Data come from many sources: government open data portals, statistical agencies, freedom of information requests, court and regulatory records, company filings, scientific datasets and leaked databases. When data are not available in usable form, journalists may build their own datasets by scraping websites, transcribing documents or collecting records case by case. Some of the most important data journalism projects have involved building a dataset that did not previously exist, because official statistics were incomplete or absent.
Cleaning data. Real-world data are messy. Names are spelled inconsistently, dates are recorded in different formats, records are duplicated, and fields are missing or wrongly entered. Cleaning can take most of the time on a project, and every change must be recorded so that it can be checked and repeated.
Understanding context. Every dataset is produced by a process, and the process shapes what the data mean. Crime statistics record crimes reported to and recorded by police, not all crimes committed. Hospital death rates depend on how sick patients were when they arrived. A change in a figure may reflect a change in how it is recorded rather than in reality. Reporters must learn how the data were collected, by whom, for what purpose and with what known problems, usually by reading the documentation and talking to the people who produce and use the data.
Analysing and combining. Much data journalism uses simple methods: counting, ranking, calculating rates and percentages, and comparing groups or periods. More complex projects use statistical modelling, geographic analysis and the linking of datasets, for example matching lists of company directors with lists of political donors or public contractors. Increasingly, journalists also use machine learning to classify documents or find patterns in large collections, although Stray (2019) found that such methods have so far been useful mainly for specific tasks, such as sorting documents, and that the main barriers are the cost of preparing data and the need for accuracy in published claims.
Verifying findings. Findings from data are hypotheses until verified. Reporters check unusual results against the original records, ask the data's producers to explain anomalies, consult independent experts, and find real cases that illustrate and test the pattern. A pattern that disappears when the data are examined more closely is better discovered before publication than after.
Communicating. Results must be presented clearly and accurately, often with charts, maps and interactive tools that let readers explore the data themselves. Good practice increasingly includes publishing the data and the methods used, so that others can check and build on the work.
Statistical pitfalls
Working with numbers introduces its own kinds of error. Huff (1954) famously catalogued the ways statistics can mislead, and later writers have updated the warnings for modern data and graphics (Cairo, 2019; Spiegelhalter, 2019).
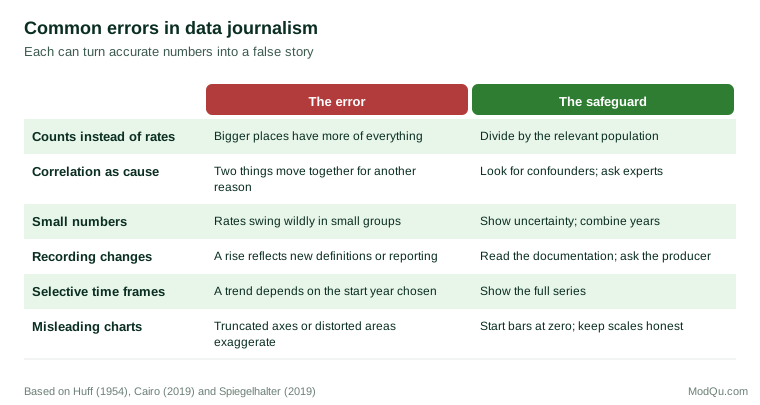
Counts and rates. A city with more crimes than another may simply have more people. Comparing raw counts across places of different sizes is one of the most common errors; rates per person, per household or per relevant population are usually needed.
Correlation and causation. Two variables may move together because one causes the other, because both are caused by a third factor, or by chance. Spiegelhalter (2019) emphasises that observational data rarely establish cause on their own and that apparent effects often shrink when other factors are taken into account.
Small numbers. Rates calculated for small groups, such as a small hospital or a small town, vary greatly from year to year by chance. Rankings based on such rates can place an institution at the top one year and the bottom the next without any real change.
Visual distortion. Tufte (2001) set out principles for honest graphics, including that the visual size of a feature should be proportional to the number it represents. Cairo (2019) shows how charts can mislead through truncated axes, inappropriate scales, cherry-picked data and missing context, even when every number is correct.
Anderson (2018) adds a broader caution. Tracing the history of data in American journalism, he argues that numbers can carry an air of certainty that leads both journalists and readers to treat them as more objective than they are. Data are produced by institutions with their own purposes and categories, and data journalism is strongest when it acknowledges these limits.
What makes data journalism valuable
Young et al. (2018) analysed finalists for international data journalism awards and found that the most highly regarded projects combined original data analysis with investigative purpose, often holding institutions to account, and used visualisation to support rather than replace the story. Loosen et al. (2020) analysed award-nominated projects over several years and found that they often relied on publicly available government data, that politics, society and economics were the most common topics, and that interactive features were common but often limited. These findings suggest that the most valuable data journalism remains rooted in the investigative questions of traditional reporting.
Data journalism has several particular strengths. It can measure the scale of a problem, turning anecdotes into evidence. It can test official claims against official data. It can reveal patterns that no single insider could see. And by publishing data and methods, it can allow readers, researchers and officials to check and extend the work. Angwin et al. (2016), for example, published the data and code behind their analysis of a criminal risk assessment tool, which allowed researchers to replicate, challenge and build on their findings.
When the data do not exist
Some of the most important data journalism begins with the discovery that no reliable data exist. Governments may not count a problem at all, may count it inconsistently across regions, or may publish only totals that hide the cases that matter. In these situations, journalists build their own datasets. They may gather records case by case from court files, inspection reports or news coverage; ask every local authority the same set of questions through freedom of information requests; or invite members of the public to report their experiences through a structured form.
Building a dataset carries particular responsibilities. The reporter must define clearly what is being counted and apply the definition consistently, record the source of every entry, and describe the dataset's gaps honestly. A dataset compiled from news reports, for example, will miss cases that were never reported, and may over-represent places with active local media. Meyer (2002) stressed that the logic of sampling and measurement applies to journalists just as much as to social scientists: a pattern is only as reliable as the process that produced the numbers.
Leaked datasets raise further questions. They can be extraordinarily valuable, as the offshore financial leaks of recent years have shown, but they must be authenticated, checked for completeness and protected. A leak may contain only part of the picture, and the reasons for its selection may be unknown. Reporters therefore treat leaked data as a starting point for reporting, and confirm key findings through independent records and interviews before publication.
Working with researchers
Data journalists increasingly work with academic researchers, statisticians and specialists in particular fields. Such collaboration can strengthen analysis, catch errors and lend credibility, while journalists bring news judgement, access to sources and the ability to reach large audiences. The two professions work to different timetables and standards, however: research is typically slower and more cautious, and its findings are often qualified in ways that do not fit easily into headlines. Agreeing in advance what each partner will contribute, how disagreements will be resolved and how uncertainty will be described helps such partnerships succeed.
Skills, ethics and the newsroom
Data journalism requires a combination of skills: spreadsheet and database analysis, statistics, often some programming, visualisation and, above all, traditional reporting. Heravi (2019) found that data journalism education was expanding but uneven, with many journalists learning on the job. Usher (2016) describes how newsrooms brought programmers and designers into journalism, creating new roles and new forms of collaboration.
Data raise ethical questions too. Datasets often contain personal information, and publishing searchable data about individuals, such as lists of gun owners or people arrested, can cause harm even when the data are public. Lewis and Westlund (2015) argue that the growing use of large datasets raises questions about expertise, accuracy and responsibility that journalism must address. Automated systems that generate stories from data, described by Diakopoulos (2019), raise further questions about errors, transparency and editorial oversight.
A short example
The following hypothetical case illustrates the process. A reporter hears from several parents that their children's school buses are often late. Rather than writing about a few complaints, the reporter requests the school district's GPS records for every bus route over a full school year.
The data arrive as several large files with inconsistent route names and missing records on some days. After cleaning and matching the records to the district's published schedules, the reporter calculates the share of journeys that arrived more than ten minutes late for each route. Before analysing further, the reporter interviews the district's transport manager and learns that GPS units were faulty on some buses for two months, so those records are excluded.
The analysis shows that late arrivals are concentrated on a small number of routes, and that these routes serve neighbourhoods with lower average incomes. To test whether this is a coincidence of geography, the reporter compares routes of similar length and traffic conditions and finds that the difference remains. Documents obtained under a freedom of information request show that the district assigned its oldest buses, which break down more often, to these routes. The reporter checks the findings with a transport researcher, presents them to the district for comment, and publishes the story with a map, a chart of late arrivals by route, and a description of the method. The district announces a review of bus assignments.
Conclusion
Data journalism applies systematic analysis to the records that institutions and societies produce, revealing patterns that individual stories cannot show. Its methods follow a clear sequence, from compiling and cleaning data through understanding its context, analysing it and verifying the results, to communicating them openly. Its main dangers are not arithmetic mistakes but errors of interpretation: comparing counts instead of rates, mistaking correlation for cause, ignoring how data were collected and presenting numbers with false certainty. Done carefully, with transparent methods and traditional reporting alongside the analysis, it is one of the most powerful forms of investigation available to journalists.
References
Anderson, C. W. (2018). Apostles of certainty: Data journalism and the politics of doubt. Oxford University Press.
Angwin, J., Larson, J., Mattu, S., & Kirchner, L. (2016, May 23). Machine bias. ProPublica.
Appelgren, E., & Nygren, G. (2014). Data journalism in Sweden: Introducing new methods and genres of journalism into "old" organizations. Digital Journalism, 2(3), 394–405. https://doi.org/10.1080/21670811.2014.884344
Borges-Rey, E. (2016). Unravelling data journalism: A study of data journalism practice in British newsrooms. Journalism Practice, 10(7), 833–843. https://doi.org/10.1080/17512786.2016.1159921
Bounegru, L., & Gray, J. (Eds.). (2021). The data journalism handbook: Towards a critical data practice. Amsterdam University Press.
Bradshaw, P. (2011, July 7). The inverted pyramid of data journalism. Online Journalism Blog.
Cairo, A. (2019). How charts lie: Getting smarter about visual information. W. W. Norton.
Coddington, M. (2015). Clarifying journalism's quantitative turn: A typology for evaluating data journalism, computational journalism, and computer-assisted reporting. Digital Journalism, 3(3), 331–348. https://doi.org/10.1080/21670811.2014.976400
Dedman, B. (1988, May 1–4). The color of money. The Atlanta Journal-Constitution.
Diakopoulos, N. (2019). Automating the news: How algorithms are rewriting the media. Harvard University Press.
Fink, K., & Anderson, C. W. (2015). Data journalism in the United States: Beyond the "usual suspects". Journalism Studies, 16(4), 467–481. https://doi.org/10.1080/1461670X.2014.939852
Gray, J., Chambers, L., & Bounegru, L. (Eds.). (2012). The data journalism handbook. O'Reilly Media.
Heravi, B. R. (2019). 3Ws of data journalism education: What, where and who? Journalism Practice, 13(3), 349–366. https://doi.org/10.1080/17512786.2018.1463167
Houston, B. (2010). The future of investigative journalism. Daedalus, 139(2), 45–56. https://doi.org/10.1162/daed.2010.139.2.45
Huff, D. (1954). How to lie with statistics. W. W. Norton.
Lewis, S. C., & Westlund, O. (2015). Big data and journalism: Epistemology, expertise, economics, and ethics. Digital Journalism, 3(3), 447–466. https://doi.org/10.1080/21670811.2014.976418
Loosen, W., Reimer, J., & De Silva-Schmidt, F. (2020). Data-driven reporting: An on-going (r)evolution? An analysis of projects nominated for the Data Journalism Awards 2013–2016. Journalism, 21(9), 1246–1263. https://doi.org/10.1177/1464884917735691
Meyer, P. (2002). Precision journalism: A reporter's introduction to social science methods (4th ed.). Rowman & Littlefield.
Spiegelhalter, D. (2019). The art of statistics: Learning from data. Pelican.
Stray, J. (2019). Making artificial intelligence work for investigative journalism. Digital Journalism, 7(8), 1076–1097. https://doi.org/10.1080/21670811.2019.1630289
Tufte, E. R. (2001). The visual display of quantitative information (2nd ed.). Graphics Press.
Usher, N. (2016). Interactive journalism: Hackers, data, and code. University of Illinois Press.
Young, M. L., Hermida, A., & Fulda, J. (2018). What makes for great data journalism? A content analysis of data journalism awards finalists 2012–2015. Journalism Practice, 12(1), 115–135. https://doi.org/10.1080/17512786.2016.1270171