
Intelligence · Analysis and tradecraft
"Expressing Probability in Intelligence Estimates: Words of Estimative Probability"
Intelligence estimates use words such as "likely" and "probable", but readers interpret them very differently. This article explains the history of the problem, what research shows about verbal and numerical probability, the standard scales now in use and how to communicate uncertainty clearly.
Intelligence is largely about things that cannot be known for certain: what an adversary intends, whether a market will grow, how a negotiation will end. Analysts must therefore express uncertainty, and they usually do it in words: an event is "likely", "possible", "a serious possibility" or "almost certain". The problem is that these words mean different things to different people. A judgement that one reader takes as a near-certainty another may read as a coin toss. This article explains the history of this problem, what research shows, the standard scales now used and practical ways to communicate probability clearly.
Sherman Kent and the "serious possibility"
The problem was famously described by Sherman Kent, the historian who led the American Office of National Estimates and is often regarded as the founder of modern intelligence analysis. In an essay titled "Words of Estimative Probability", Kent (1964) recounted that a 1951 estimate had judged a Soviet attack on Yugoslavia to be "a serious possibility". When Kent later asked colleagues who had agreed the wording what odds they had in mind, their answers ranged from roughly 20 per cent to 80 per cent. The same phrase, agreed by the same group, concealed views that ranged from "unlikely" to "likely".
Kent proposed linking a small set of words to numerical ranges, for example treating "probable" as roughly 75 per cent, give or take about 12 points, and "almost certain" as around 93 per cent. Kent described resistance from colleagues labelled "poets", who felt that numbers implied false precision, as opposed to the "mathematicians", who wanted clarity. The essay was later reprinted with Kent's other writings (Steury, 1994), and the debate it began has continued ever since.
How people interpret probability words
Research has confirmed Kent's observation many times. Beyth-Marom (1982) asked people to translate common probability expressions into numbers and found wide variation between individuals for most phrases. Wallsten et al. (1986) showed that each person's understanding of a word is better described as a range than as a single value, and that these ranges differ substantially from person to person even though each individual is fairly consistent. Mosteller and Youtz (1990), reviewing many studies, found that average interpretations of some words were reasonably stable across studies, but the spread between individuals was large, and context affected meaning.
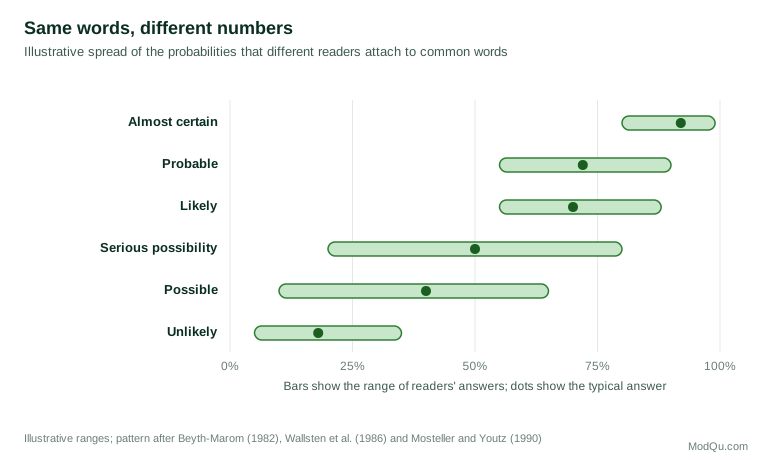
Context matters too. "Likely" applied to rain tomorrow may be read differently from "likely" applied to a war or a company bankruptcy. Readers also tend to interpret words in light of the severity of the outcome, reading a "possible" catastrophe as more probable than a "possible" minor inconvenience.
Even numbers can be misunderstood if the event is not defined. Gigerenzer et al. (2005) asked people in several cities what a "30 per cent chance of rain tomorrow" meant. Many did not interpret it as the forecasters intended, that it would rain on 30 per cent of days with similar forecasts, but as rain for 30 per cent of the time or over 30 per cent of the area. Clear communication requires defining the event as well as the probability.
Lessons from climate science
Intelligence is not the only field that has wrestled with this problem. The Intergovernmental Panel on Climate Change adopted a calibrated language, in which terms such as "very likely" and "likely" correspond to defined probability ranges, alongside a separate scale for confidence based on the amount of evidence and the degree of agreement (Mastrandrea et al., 2010).
Budescu et al. (2009) tested how the public interpreted the panel's statements. Readers consistently interpreted the terms less extremely than intended: "very likely", meant to indicate more than 90 per cent, was often read as much lower. Providing the numerical range alongside the word, rather than only in a separate glossary, substantially improved agreement between intended and understood meanings. Budescu et al. (2014) found the same pattern in many countries and languages. Ho et al. (2015) compared the approaches used in climate science and intelligence analysis and recommended scales whose verbal categories are tested empirically and presented with numbers.
Standard scales in intelligence
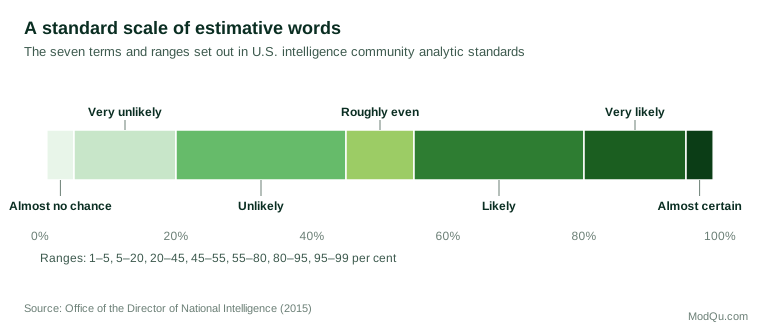
Many intelligence organisations now use standard scales. The American intelligence community's analytic standards set out seven terms, each linked to a probability range, from "almost no chance" (1 to 5 per cent) to "almost certain" (95 to 99 per cent) (Office of the Director of National Intelligence, 2015). Other countries use similar scales, sometimes with deliberate gaps between categories to discourage false precision. Dhami and Mandel (2021) review these scales and note that they differ in the number of categories, the ranges assigned and the way they are presented, which can cause confusion when products from different organisations are compared.
The case for numbers
Several researchers argue that analysts should go further and use numerical probabilities directly. Friedman and Zeckhauser (2012) argue that vague language allows analysts to avoid accountability and makes it harder for decision-makers to compare risks. Friedman (2019) examines objections to numerical probability in foreign policy, such as claims that numbers imply false precision or that some events are too uncertain to quantify, and argues that these objections do not withstand scrutiny: decision-makers must weigh probabilities anyway, and it is better that they do so explicitly.
Evidence supports the value of precision. Friedman et al. (2018) analysed a very large set of forecasts from a geopolitical forecasting tournament and found that rounding forecasts into broader categories, such as the seven-step verbal scales, systematically reduced their accuracy. The finer distinctions forecasters made carried real information. Tetlock and Gardner (2015) describe how the most accurate forecasters routinely distinguished between probabilities such as 60 and 65 per cent and updated in small steps. Mellers et al. (2014) found that training in probabilistic reasoning, teamwork and tracking improved accuracy in the same tournament.
Numerical probabilities also allow accuracy to be measured. The Brier score, introduced by Brier (1950) for weather forecasts, measures the average squared difference between forecast probabilities and actual outcomes, rewarding both calibration and discrimination. Mandel and Barnes (2014) applied this kind of scoring to well over a thousand forecasts drawn from strategic intelligence assessments produced by a Canadian intelligence unit that used numerical probabilities. They found that the forecasts discriminated well between events that did and did not occur and were reasonably well calibrated, though somewhat underconfident. Barnes (2016) describes how that unit introduced numbers and the lessons it learned.
Probability and confidence
Analysts often need to communicate two different things: how likely an event is, and how much confidence they have in that judgement. Friedman and Zeckhauser (2012) and the analytic standards (Office of the Director of National Intelligence, 2015) both stress keeping them separate. Probability concerns the event; confidence concerns the quality of the evidence and reasoning behind the estimate. An analyst might judge an event "likely" with low confidence because sources are thin, or "unlikely" with high confidence because the evidence is extensive and consistent. Mixing the two in a single phrase, such as "we believe with moderate confidence that it is likely", confuses many readers unless both terms are defined.
Overconfidence and noise
Explicit probabilities expose two problems that words hide. The first is overconfidence: Moore and Healy (2008) show that people are often too sure of their estimates, and numerical probabilities, compared later with outcomes, reveal this. The second is noise: Kahneman et al. (2021) show that people given the same information often give widely different judgements. Standard scales and numbers make such disagreements visible, so that they can be discussed and reduced, instead of being concealed by agreed words that each person reads differently.
Presenting uncertainty
Spiegelhalter et al. (2011) review ways of presenting uncertainty about the future, from verbal statements and numbers to ranges, fan charts and icon arrays, and stress that the right format depends on the audience and purpose. Some practical principles follow from the research:
- Define the event precisely. State what will happen, by when and how it will be recognised.
- Use a standard scale, and show the numbers. Put the numerical range next to the word, not in a footnote.
- Consider using numbers directly for important judgements, especially when decisions depend on comparing risks.
- Separate probability from confidence. Say how likely the event is and, separately, how strong the evidence is.
- Explain the basis. Give the main reasons for the estimate and what would change it.
- Track and score. Record probabilities and check them against outcomes, so that the organisation learns how well calibrated it is.
Objections and answers
Some analysts resist numerical probabilities. Common objections include:
- "Numbers imply false precision." A number is a statement of belief, not a claim of measurement. Stating 70 per cent does not imply certainty about the third decimal place; it simply makes the belief clear.
- "Some events are unique and cannot be assigned probabilities." Decision-makers must still act on some view of how likely such events are. Friedman (2019) argues that refusing to state a probability does not remove uncertainty; it merely hides the analyst's view.
- "Readers will misuse numbers." Readers also misinterpret words, as the research shows, and in less predictable ways.
- "Numbers expose analysts to blame." They do expose analysts to scrutiny, which is the point. Scoring over many judgements, rather than blaming individual misses, is the fair way to evaluate accuracy.
Probability in business intelligence
The same problem appears in companies. Market research, competitive intelligence and risk teams routinely tell executives that a competitor is "likely" to cut prices, that a regulation "may" pass or that a project has a "high" risk of delay. Executives then translate these words into budgets, contracts and staffing. If the analyst meant 60 per cent and the executive heard 90 per cent, the organisation commits resources to an outcome that is far from assured. If the executive heard 40 per cent, it may fail to prepare for something that is more likely than not.
Business settings also make the cost of vague language easier to see. A probability can be combined with a financial impact to estimate expected loss or gain, and that calculation is impossible with words alone. Friedman (2019) argues that the reluctance to state numbers often reflects a fear of being held accountable rather than any real inability to estimate. Companies that ask for numbers make their analysts' reasoning visible and give decision-makers something they can use directly in planning.
Building a scoring system
Stating probabilities is only half the task; the other half is learning from them. A simple scoring system needs four elements. First, every forecast must define the event precisely, with a deadline, so that it can later be judged true or false without argument. Second, the probability must be recorded at the time it is given, not reconstructed afterwards. Third, outcomes must be recorded when the deadline passes. Fourth, accuracy must be measured with a proper scoring rule.
The most widely used measure is the Brier score, proposed for weather forecasting (Brier, 1950). It is the mean squared difference between the forecast probability and the outcome, coded as 1 if the event happened and 0 if it did not. A forecaster who always says 50 per cent scores 0.25; perfect foresight scores 0; lower is better. The Brier score rewards both calibration, meaning that events given 70 per cent happen about 70 per cent of the time, and discrimination, meaning that the forecaster gives higher probabilities to events that do occur. Mellers et al. (2014) used this approach in a large forecasting tournament and showed that accuracy improved with training, teaming and tracking. Mandel and Barnes (2014) applied the same logic to real intelligence judgements and found them better calibrated than many critics expected, though somewhat underconfident.
A scoring system does not need to be elaborate. A spreadsheet listing the question, the date, the probability, the analyst and the outcome is enough to begin. After a year, a team can plot how often its "likely" judgements came true and adjust its language if they came true much more or much less often than intended.
Common mistakes
Several errors recur in organisations that try to improve probability language:
- Undefined events. "The merger is likely to succeed" cannot be scored, because "succeed" has no agreed meaning. A good forecast states what will count as the event and by when.
- Hedging words. Terms such as "could", "may" and "cannot be ruled out" carry almost no information, since nearly anything could happen. Readers interpret them very differently (Beyth-Marom, 1982), and they protect the writer more than they inform the reader.
- Mixing probability and confidence. Saying "we are moderately confident that the event is likely" is often read as a single, lower probability. The two should be stated separately, as ICD 203 requires (Office of the Director of National Intelligence, 2015).
- Changing scales between reports. If one team uses five categories and another uses seven, readers cannot compare their judgements.
- False precision. Writing 63 per cent when the evidence supports only "roughly two in three" invites distrust. Rounding to the nearest five or ten per cent is usually sufficient, although Friedman et al. (2018) show that analysts' fine distinctions do carry real information.
Training analysts
Research suggests that the skill of assigning probabilities can be taught. Mellers et al. (2014) found that about an hour of training in probabilistic reasoning, covering base rates, the use of reference classes and the avoidance of common biases, measurably improved forecasting accuracy over a full year. Tetlock and Gardner (2015) describe the habits of the most accurate forecasters: breaking problems into parts, starting from base rates, updating in small steps as evidence arrives and keeping score.
Training also helps readers. Gigerenzer et al. (2005) showed that even a simple statement such as "a 30 per cent chance of rain" is misunderstood when the reference class is unclear: some people think it means rain over 30 per cent of the area or 30 per cent of the time. Intelligence products should therefore explain once, in a standard note, what their probability terms mean, and decision-makers should be briefed on how to read them. Spiegelhalter et al. (2011) recommend combining words, numbers and simple graphics, since different readers grasp uncertainty best in different forms.
An illustration
A Canadian manufacturer's intelligence team writes that a key supplier is "likely" to raise prices next quarter. The purchasing director reads "likely" as near-certain and begins renegotiating contracts; the finance director reads it as "maybe" and leaves the budget unchanged. After adopting a standard scale with numbers shown, the team rewrites the judgement: "We estimate a 65 per cent chance (likely) that the supplier will raise list prices by at least 5 per cent before 31 March. Confidence is moderate: two independent sources report the plan, but the supplier has delayed similar increases before." Both directors now plan on the same basis, and the team records the forecast so that its accuracy can be checked in April.
Conclusion
Words of estimative probability have been a problem since Sherman Kent discovered that a "serious possibility" meant anything from 20 to 80 per cent to the people who agreed it. Research since then has shown that probability words are interpreted inconsistently, that showing numbers alongside words improves understanding, and that precise probabilities carry real information. Intelligence organisations increasingly use standard scales, and some use numbers directly. The most reliable practice is to define events clearly, state probabilities numerically or with defined ranges, separate probability from confidence, explain the reasoning and track accuracy over time.
References
Barnes, A. (2016). Making intelligence analysis more intelligent: Using numeric probabilities. Intelligence and National Security, 31(3), 327–344. https://doi.org/10.1080/02684527.2014.994955
Beyth-Marom, R. (1982). How probable is probable? A numerical translation of verbal probability expressions. Journal of Forecasting, 1(3), 257–269. https://doi.org/10.1002/for.3980010305
Brier, G. W. (1950). Verification of forecasts expressed in terms of probability. Monthly Weather Review, 78(1), 1–3. https://doi.org/10.1175/1520-0493(1950)078<0001:VOFEIT>2.0.CO;2
Budescu, D. V., Broomell, S., & Por, H.-H. (2009). Improving communication of uncertainty in the reports of the Intergovernmental Panel on Climate Change. Psychological Science, 20(3), 299–308. https://doi.org/10.1111/j.1467-9280.2009.02284.x
Budescu, D. V., Por, H.-H., Broomell, S. B., & Smithson, M. (2014). The interpretation of IPCC probabilistic statements around the world. Nature Climate Change, 4(6), 508–512. https://doi.org/10.1038/nclimate2194
Dhami, M. K., & Mandel, D. R. (2021). Words or numbers? Communicating probability in intelligence analysis. American Psychologist, 76(3), 549–560. https://doi.org/10.1037/amp0000637
Friedman, J. A., & Zeckhauser, R. (2012). Assessing uncertainty in intelligence. Intelligence and National Security, 27(6), 824–847. https://doi.org/10.1080/02684527.2012.708275
Friedman, J. A. (2019). War and chance: Assessing uncertainty in international politics. Oxford University Press.
Friedman, J. A., Baker, J. D., Mellers, B. A., Tetlock, P. E., & Zeckhauser, R. (2018). The value of precision in probability assessment: Evidence from a large-scale geopolitical forecasting tournament. International Studies Quarterly, 62(2), 410–422. https://doi.org/10.1093/isq/sqx078
Gigerenzer, G., Hertwig, R., van den Broek, E., Fasolo, B., & Katsikopoulos, K. V. (2005). "A 30% chance of rain tomorrow": How does the public understand probabilistic weather forecasts? Risk Analysis, 25(3), 623–629. https://doi.org/10.1111/j.1539-6924.2005.00608.x
Ho, E. H., Budescu, D. V., Dhami, M. K., & Mandel, D. R. (2015). Improving the communication of uncertainty in climate science and intelligence analysis. Behavioral Science & Policy, 1(2), 43–55.
Kahneman, D., Sibony, O., & Sunstein, C. R. (2021). Noise: A flaw in human judgment. Little, Brown Spark.
Kent, S. (1964). Words of estimative probability. Studies in Intelligence, 8(4), 49–65.
Mandel, D. R., & Barnes, A. (2014). Accuracy of forecasts in strategic intelligence. Proceedings of the National Academy of Sciences, 111(30), 10984–10989. https://doi.org/10.1073/pnas.1406138111
Mastrandrea, M. D., Field, C. B., Stocker, T. F., Edenhofer, O., Ebi, K. L., Frame, D. J., Held, H., Kriegler, E., Mach, K. J., Matschoss, P. R., Plattner, G.-K., Yohe, G. W., & Zwiers, F. W. (2010). Guidance note for lead authors of the IPCC Fifth Assessment Report on consistent treatment of uncertainties. Intergovernmental Panel on Climate Change.
Mellers, B., Ungar, L., Baron, J., Ramos, J., Gurcay, B., Fincher, K., Scott, S. E., Moore, D., Atanasov, P., Swift, S. A., Murray, T., Stone, E., & Tetlock, P. E. (2014). Psychological strategies for winning a geopolitical forecasting tournament. Psychological Science, 25(5), 1106–1115. https://doi.org/10.1177/0956797614524255
Moore, D. A., & Healy, P. J. (2008). The trouble with overconfidence. Psychological Review, 115(2), 502–517. https://doi.org/10.1037/0033-295X.115.2.502
Mosteller, F., & Youtz, C. (1990). Quantifying probabilistic expressions. Statistical Science, 5(1), 2–12. https://doi.org/10.1214/ss/1177012242
Office of the Director of National Intelligence. (2015). Intelligence Community Directive 203: Analytic standards.
Spiegelhalter, D., Pearson, M., & Short, I. (2011). Visualizing uncertainty about the future. Science, 333(6048), 1393–1400. https://doi.org/10.1126/science.1191181
Steury, D. P. (Ed.). (1994). Sherman Kent and the Board of National Estimates: Collected essays. Center for the Study of Intelligence, Central Intelligence Agency.
Tetlock, P. E., & Gardner, D. (2015). Superforecasting: The art and science of prediction. Crown.
Wallsten, T. S., Budescu, D. V., Rapoport, A., Zwick, R., & Forsyth, B. (1986). Measuring the vague meanings of probability terms. Journal of Experimental Psychology: General, 115(4), 348–365. https://doi.org/10.1037/0096-3445.115.4.348