
Intelligence · Business intelligence
Descriptive, Diagnostic, Predictive and Prescriptive Analytics
Analytics is often divided into four kinds, each answering a different question about the business. This article explains what each kind does, the methods it uses, its typical pitfalls and how they fit together in practice.
Organisations use data to answer many different questions. What were last month's sales? Why did they fall in one region? What will they be next quarter? How much stock should we order, and at what price should we sell? These questions differ not only in subject but in kind, and each kind calls for different methods, different data and different levels of skill. A common way of organising them divides analytics into four types: descriptive, diagnostic, predictive and prescriptive. This article explains each type, the methods it uses, its pitfalls, and how they work together.
A framework of four questions
Davenport and Harris (2007), in their study of organisations that compete on analytics, described a progression from reports that show what happened to models that predict and optimise. Holsapple et al. (2014), reviewing many definitions of business analytics, found that most emphasise this movement from description to prediction and prescription, along with the idea that analytics is a means of improving decisions rather than an end in itself. Figure 1 summarises the four types.
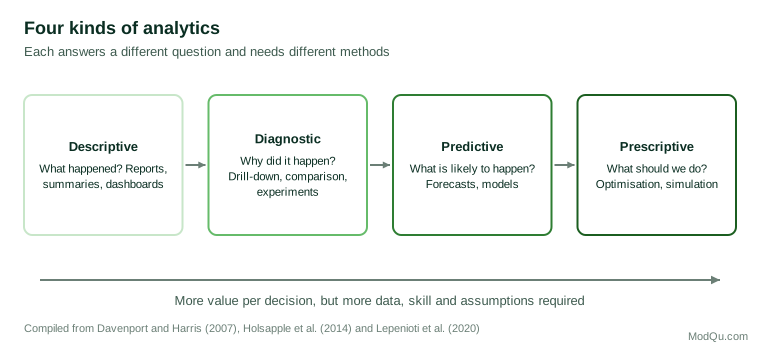
The four types are not rungs on a ladder that an organisation climbs and leaves behind. Prescriptive models depend on good predictions, predictions depend on understanding causes, and all depend on accurate description. Weakness at the bottom undermines everything above it.
Descriptive analytics: what happened?
Descriptive analytics summarises past and current data: sales by month, customers by region, complaints by type. Its tools are reports, dashboards, summary statistics and charts. It is the oldest and most widely used form of business intelligence, and Chen et al. (2012) describe how it was built on data warehouses and reporting tools in the first era of business intelligence.
Descriptive work is often dismissed as simple, but doing it well is not. It requires accurate, consistent data; careful definitions; and displays that make important patterns visible. Tukey (1977) argued that exploring data with simple summaries and graphs, before testing any hypothesis, often reveals the most important features of a problem. Much of the value of analytics comes from accurate description that lets people see what is actually happening rather than what they assume is happening.
Its main limitation is that it does not explain. A report showing that sales fell does not say why, and managers tend to fill the gap with their own explanations, which may be wrong.
Diagnostic analytics: why did it happen?
Diagnostic analytics seeks the causes of what descriptive analytics reveals. Its simplest methods are drilling down into data, for example from total sales to sales by region, store and product, and comparing groups that differ in some respect. More rigorous methods test causes directly.
The central difficulty is distinguishing correlation from causation. Sales may have fallen in stores that cut staff, but those stores may also have been in declining neighbourhoods. Pearl and Mackenzie (2018) explain why data alone cannot reveal causes without assumptions about how the variables are related, and how causal reasoning can make those assumptions explicit. Angrist and Pischke (2009) describe the methods economists use to estimate causal effects from observational data, such as comparing similar groups before and after a change, or exploiting natural experiments.
The most reliable diagnostic method is a controlled experiment. Kohavi et al. (2009) describe how online businesses test changes by randomly assigning users to different versions of a website and comparing the results. Randomisation ensures that differences in outcomes are caused by the change, not by differences between the groups. Where experiments are possible, they turn diagnosis from argument into evidence.
Predictive analytics: what is likely to happen?
Predictive analytics uses patterns in past data to estimate future or unknown outcomes: next quarter's demand, which customers are likely to leave, which transactions are likely to be fraudulent. Its methods range from classical statistical forecasting to machine learning. Hastie et al. (2009) provide the standard reference for the statistical learning methods that underpin much predictive modelling; Hyndman and Athanasopoulos (2021) provide a practical guide to forecasting time series.
Prediction is not explanation
Shmueli (2010) drew an important distinction between models built to explain and models built to predict. An explanatory model aims to identify causes and estimate their effects; a predictive model aims to forecast outcomes accurately, whether or not its inputs are causes. A model that predicts customer churn very well may rely on signals, such as reduced use of the product, that are symptoms rather than causes. It is useful for identifying who is at risk, but not necessarily for deciding what will prevent them leaving. Breiman (2001) described the tension between statistical traditions focused on modelling the process that generated the data and those focused purely on predictive accuracy, arguing that both have their place.
Simple methods often do well
Makridakis et al. (2018) compared statistical and machine learning methods on a large set of time series and found that the simpler statistical methods often forecast as accurately as, or more accurately than, more complex machine learning methods, at far lower computational cost. Sophistication does not guarantee accuracy.
Predictions can fail
Predictive models assume that the patterns of the past will continue. When conditions change, they can fail badly. Ginsberg et al. (2009) showed that internet search queries could track influenza activity in the United States closely, offering earlier estimates than official surveillance. Lazer et al. (2014) later documented how the same approach substantially overestimated influenza levels in subsequent seasons, partly because search behaviour and the search engine itself changed. They warned against "big data hubris", the assumption that large volumes of data can replace careful measurement and validation.
Tetlock and Gardner (2015), studying human forecasters, found that the best kept score of their accuracy and updated their forecasts as new evidence arrived. The same discipline applies to predictive models: their performance should be monitored continuously, and they should be retrained or retired when they stop working.
Prescriptive analytics: what should we do?
Prescriptive analytics recommends actions. It combines predictions with models of the decision, including the options available, their costs and constraints, and the objectives, to identify the best course of action. Its methods include optimisation, simulation and decision analysis. Examples include setting prices to maximise revenue, scheduling staff to meet forecast demand at lowest cost, and routing deliveries.
Lepenioti et al. (2020), reviewing research on prescriptive analytics, describe it as the least mature of the four types in practice, despite long roots in operations research. Its challenges include the need for accurate predictions, explicit and agreed objectives, and models of how the business responds to different actions. Bertsimas and Kallus (2020) show how machine learning predictions can be integrated directly into optimisation, so that recommendations account for uncertainty in the predictions rather than treating a single forecast as certain.
Prescriptive models are only as good as their assumptions. A pricing model that ignores competitors' reactions, or a staffing model that ignores employee well-being, will recommend actions that look optimal on paper and fail in practice.
Human judgement and trust
As analytics moves from description towards prescription, decisions are increasingly shared between people and models. This creates its own difficulties. Dietvorst et al. (2015) found that people lose confidence in an algorithm after seeing it make a mistake, and often prefer their own judgement even when the algorithm is more accurate, a pattern they called algorithm aversion. The opposite problem also occurs: people may follow model recommendations uncritically when the model is applied outside the conditions for which it was built.
Sharma et al. (2014) argue that the value of analytics depends on how organisations integrate insights into decision-making processes. Analytical outputs must be understood, trusted to the right degree and combined with knowledge that the model does not contain. Provost and Fawcett (2013) emphasise that data-driven decision-making is a practice that involves people and processes, not only algorithms.
How the four fit together: an example
Consider a chain of grocery stores facing rising food waste.
- Descriptive: Reports show that waste of fresh produce has risen from 4% to 7% of sales over a year, concentrated in twenty stores.
- Diagnostic: Analysts compare those stores with others and find that most recently switched to a new ordering schedule with fewer, larger deliveries. A trial in which some stores return to more frequent deliveries, chosen at random, confirms that the schedule change explains much of the increase.
- Predictive: A forecasting model estimates daily demand for each product in each store, accounting for day of week, season, weather and promotions.
- Prescriptive: An optimisation model uses those forecasts, together with delivery costs and shelf life, to recommend order quantities and delivery frequencies that minimise the combined cost of waste, stock-outs and transport.
Each stage depended on the one before. Without accurate description, the problem would not have been seen; without diagnosis, the wrong cause might have been addressed; without good forecasts, the optimisation would have recommended the wrong quantities.
What each type demands
The four types also differ in what they require of an organisation. Descriptive analytics needs clean, integrated data and people who can design clear reports. Diagnostic analytics needs analysts trained in comparison and causal reasoning, and a willingness to run experiments, which may mean deliberately treating some customers or stores differently. Predictive analytics needs historical data covering the conditions to be forecast, statistical or machine learning skills, and systems to monitor model accuracy over time. Prescriptive analytics needs all of these, plus agreement among managers on objectives and constraints, which is often harder to obtain than the data. An organisation that lacks the foundations for one type will struggle with the types that build on it.
Choosing where to invest
Organisations often feel pressure to move quickly to predictive and prescriptive analytics because they sound more advanced. The research suggests a more measured approach:
- Get description right first. Accurate, trusted data and clear reports are the foundation of everything else.
- Ask why before predicting. Understanding causes prevents expensive mistakes and makes predictions more robust.
- Use experiments where possible. They provide the most reliable evidence of cause and effect.
- Start simple. Simple forecasting and decision models are easier to understand, test and maintain, and often perform as well as complex ones.
- Monitor performance. Track the accuracy of predictions and the outcomes of recommended actions, and revise models when they drift.
- Keep people in the loop. Combine analytical outputs with human knowledge, and design processes in which people understand when to trust and when to question a model.
Conclusion
The four kinds of analytics answer four different questions: what happened, why, what is likely to happen and what to do. They form a sequence in which each depends on the ones before. The greatest value often comes not from the most sophisticated methods but from doing each step well: describing accurately, diagnosing causes rigorously, predicting with humility and prescribing with explicit, tested assumptions. Organisations that build these capabilities in order, and keep human judgement engaged throughout, get the most from their data.
References
Angrist, J. D., & Pischke, J.-S. (2009). Mostly harmless econometrics: An empiricist's companion. Princeton University Press. https://doi.org/10.1515/9781400829828
Bertsimas, D., & Kallus, N. (2020). From predictive to prescriptive analytics. Management Science, 66(3), 1025–1044. https://doi.org/10.1287/mnsc.2018.3253
Breiman, L. (2001). Statistical modeling: The two cultures. Statistical Science, 16(3), 199–231. https://doi.org/10.1214/ss/1009213726
Chen, H., Chiang, R. H. L., & Storey, V. C. (2012). Business intelligence and analytics: From big data to big impact. MIS Quarterly, 36(4), 1165–1188. https://doi.org/10.2307/41703503
Davenport, T. H., & Harris, J. G. (2007). Competing on analytics: The new science of winning. Harvard Business School Press.
Dietvorst, B. J., Simmons, J. P., & Massey, C. (2015). Algorithm aversion: People erroneously avoid algorithms after seeing them err. Journal of Experimental Psychology: General, 144(1), 114–126. https://doi.org/10.1037/xge0000033
Ginsberg, J., Mohebbi, M. H., Patel, R. S., Brammer, L., Smolinski, M. S., & Brilliant, L. (2009). Detecting influenza epidemics using search engine query data. Nature, 457(7232), 1012–1014. https://doi.org/10.1038/nature07634
Hastie, T., Tibshirani, R., & Friedman, J. (2009). The elements of statistical learning: Data mining, inference, and prediction (2nd ed.). Springer. https://doi.org/10.1007/978-0-387-84858-7
Holsapple, C., Lee-Post, A., & Pakath, R. (2014). A unified foundation for business analytics. Decision Support Systems, 64, 130–141. https://doi.org/10.1016/j.dss.2014.05.013
Hyndman, R. J., & Athanasopoulos, G. (2021). Forecasting: Principles and practice (3rd ed.). OTexts.
Kohavi, R., Longbotham, R., Sommerfield, D., & Henne, R. M. (2009). Controlled experiments on the web: Survey and practical guide. Data Mining and Knowledge Discovery, 18(1), 140–181. https://doi.org/10.1007/s10618-008-0114-1
Lazer, D., Kennedy, R., King, G., & Vespignani, A. (2014). The parable of Google Flu: Traps in big data analysis. Science, 343(6176), 1203–1205. https://doi.org/10.1126/science.1248506
Lepenioti, K., Bousdekis, A., Apostolou, D., & Mentzas, G. (2020). Prescriptive analytics: Literature review and research challenges. International Journal of Information Management, 50, 57–70. https://doi.org/10.1016/j.ijinfomgt.2019.04.003
Makridakis, S., Spiliotis, E., & Assimakopoulos, V. (2018). Statistical and machine learning forecasting methods: Concerns and ways forward. PLOS ONE, 13(3), Article e0194889. https://doi.org/10.1371/journal.pone.0194889
Pearl, J., & Mackenzie, D. (2018). The book of why: The new science of cause and effect. Basic Books.
Provost, F., & Fawcett, T. (2013). Data science and its relationship to big data and data-driven decision making. Big Data, 1(1), 51–59. https://doi.org/10.1089/big.2013.1508
Sharma, R., Mithas, S., & Kankanhalli, A. (2014). Transforming decision-making processes: A research agenda for understanding the impact of business analytics on organisations. European Journal of Information Systems, 23(4), 433–441. https://doi.org/10.1057/ejis.2014.17
Shmueli, G. (2010). To explain or to predict? Statistical Science, 25(3), 289–310. https://doi.org/10.1214/10-STS330
Tetlock, P. E., & Gardner, D. (2015). Superforecasting: The art and science of prediction. Crown.
Tukey, J. W. (1977). Exploratory data analysis. Addison-Wesley.