
Insights · Communicating insight
Training for Insight Literacy Among Non-Analyst Decision Makers
What decision makers who are not analysts need to know to use insight well, the evidence that statistical reasoning and judgement can be taught, how to design training that transfers to real decisions, and how to evaluate it.
Insight teams spend a great deal of effort improving how they communicate with decision makers. Less attention goes to the other side of the exchange: the ability of decision makers to understand, question and use what they are shown. A manager who cannot tell a meaningful difference from noise, who reads a correlation as a cause, or who does not know which questions to ask about a survey is at the mercy of whoever presents the most confident story. Insight literacy is the set of skills that allows non-analysts to use evidence well. This article describes what it involves, what research shows about whether it can be taught, and how to design training that changes how decisions are made.
What insight literacy is
Insight literacy overlaps with several established ideas. Gal (2002) defined adult statistical literacy as the ability to interpret and critically evaluate statistical information and data-related arguments, and to discuss or communicate one's reactions to them. Gal argued that it depends not only on knowledge of statistics but also on general literacy, knowledge of the context, a set of critical questions, and a disposition to question claims. Wolff et al. (2016) reviewed definitions of data literacy and described it as the ability to ask and answer questions using data, including understanding how data are collected and what they can and cannot show.
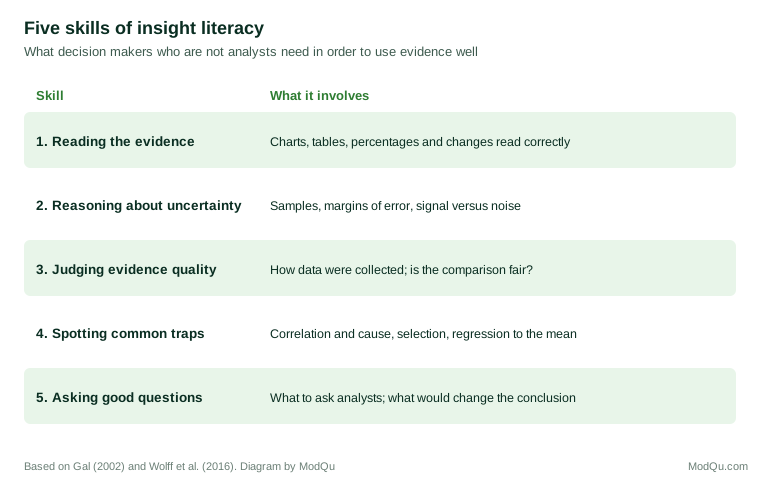
For decision makers in organisations, insight literacy does not mean the ability to perform analyses. It means the ability to:
Why it matters
There is wide variation in people's ability to work with numbers, even among educated professionals. Lipkus et al. (2001) found that a substantial share of highly educated participants answered simple questions about percentages and probabilities incorrectly. Cokely et al. (2012) developed the Berlin Numeracy Test to measure statistical numeracy and risk literacy, and found large differences between people even in highly educated samples, which predicted how well they understood information about risk. Galesic and Garcia-Retamero (2011) found similar variation in graph literacy.
Professionals are not immune. Gigerenzer et al. (2007) reviewed evidence that many doctors misunderstand basic health statistics, such as the meaning of a positive test result or the difference between relative and absolute risk, and argued that this "collective statistical illiteracy" leads to poor decisions by both doctors and patients. Belia et al. (2005) found that many published researchers misinterpreted error bars on charts.
Low insight literacy has practical costs. Decision makers who cannot judge evidence may defer to whoever presents most persuasively, overreact to random fluctuations, or ignore findings because they do not understand them. Davenport and Harris (2007) argued that organisations that compete successfully on analytics need not only skilled analysts but also senior managers who understand and demand evidence. Brynjolfsson et al. (2011) found that firms that reported making decisions based on data had higher productivity than would be expected from their other investments, which suggests that the use of evidence by decision makers, not only its production, matters.
Self-service analytics raises the stakes
The need for insight literacy has grown as organisations have given managers direct access to data. Self-service dashboards allow anyone to filter results by region, product or period, and automated tools can generate charts and written summaries on request. These tools remove the analyst as an intermediary, which saves time but also removes a check. A manager who filters a dashboard until a favourable pattern appears, or who reads an automatically generated summary without asking how many comparisons lay behind it, can reach confident conclusions from noise.
In this environment, the skills of insight literacy are no longer only about understanding what analysts present. They are about using data responsibly without an analyst present. The questions a trained decision maker asks of an analyst's report are the same ones they need to ask of their own dashboard explorations: how many people is this based on, compared with what, how big is the difference, and could it be chance? Organisations that expand access to data without building these skills risk multiplying the number of people who can draw wrong conclusions quickly.
Can statistical reasoning be taught?
An old view held that general reasoning skills cannot be taught, because people learn only specific rules that do not transfer to new situations. Research has challenged this.
Fong et al. (1986) gave participants brief training in the "law of large numbers", the principle that larger samples give more reliable estimates, and found that it improved their reasoning about everyday problems, including problems in domains quite different from the training examples. Training that combined an abstract rule with concrete examples was more effective than either alone. Lehman et al. (1988) found that graduate students in psychology and medicine, fields that involve training in statistical and methodological reasoning, improved substantially over two years on tests of statistical and methodological reasoning about everyday events, while students in law and chemistry improved much less on these tests.
How information is represented matters as much as how it is taught. Gigerenzer and Hoffrage (1995) showed that people reason about probabilities far more accurately when information is presented as natural frequencies ("8 out of 1,000") than as conditional probabilities. Sedlmeier and Gigerenzer (2001) compared two kinds of brief training in this type of reasoning: one taught participants to apply a formula, the other taught them to translate problems into frequency representations. Both improved performance immediately, but the gains from the formula training faded considerably over the following weeks, while the gains from the frequency training were largely maintained. Hoffrage et al. (2000) showed that presenting statistical information as natural frequencies improved the reasoning of professionals such as doctors and lawyers in their own domains.
Training can also reduce cognitive biases. Morewedge et al. (2015) found that a single training session, delivered through either an interactive video game or an instructional video, reduced several biases, including confirmation bias and the tendency to attribute behaviour to personality rather than circumstances, with effects that persisted for at least two months. Sellier et al. (2019) found that business students who had played such a training game were less likely to show confirmation bias when solving a business case presented weeks later in an unrelated class, evidence that the training transferred to a realistic setting.
Judgement under uncertainty can be improved too. Mellers et al. (2014) found that about one hour of training in probabilistic reasoning, covering topics such as using base rates, averaging forecasts and avoiding common biases, improved the accuracy of forecasters in a large geopolitical forecasting tournament. Tetlock and Gardner (2015) described the habits of the most accurate forecasters, including breaking problems into parts, starting from base rates and updating beliefs incrementally as evidence arrives, and argued that these habits can be learned.
What to teach
Based on this research, a practical curriculum for non-analyst decision makers might cover five areas.
Reading the evidence
- Interpreting common chart types correctly, including scales and axes.
- Understanding percentages, percentage points and relative and absolute change.
- Translating probabilities into natural frequencies.
- Recognising when a chart's design exaggerates or hides an effect.
Reasoning about uncertainty
- Why sample size matters and what a margin of error means.
- Telling a real change from normal variation.
- Regression to the mean: why extreme results tend to be followed by less extreme ones.
- What a confidence interval does and does not mean.
Judging evidence quality
- How data were collected, and who is missing.
- Whether a comparison is fair: like with like, same period, same definitions.
- The difference between correlation and causation, and what kinds of evidence support causal claims.
- How many analyses were done, and whether the reported result was selected.
Spotting common traps
- Survivorship bias, selection bias and Simpson's paradox.
- Selective time windows and comparisons.
- Overconfidence in single studies and vivid examples.
Asking good questions
The most practical skill may be knowing what to ask. A short set of questions that any decision maker can put to any analysis covers much of what matters:
- How was this measured, and who is included?
- Compared with what?
- How big is the effect, in absolute terms?
- How sure are we, and could this be chance?
- What else could explain it?
- What would change your conclusion?
Schwartz et al. (2009) found that a simple, standardised "drug facts box" summarising benefits and harms in absolute numbers improved people's understanding of medicines and their ability to choose the better drug. A standard set of questions plays a similar role for insight, giving decision makers a consistent way to examine evidence.
Common misreadings, and how training helps
A few misreadings appear again and again in organisations. Each can be addressed with a short exercise.
Percentages and percentage points. A report says that the share of customers who would recommend the company rose from 20% to 25%. One manager describes this as a 5% increase, another as a 25% increase. Both numbers can be defended, but they are different statements, and confusion between them leads to overstated or understated results. Training that asks participants to express the same change in both ways, and to give the starting and ending values, removes the ambiguity.
Regression to the mean. A company identifies its ten worst-performing stores, sends a support team, and finds that most of them improve the following quarter. The support team is credited. But stores chosen because they had an unusually bad quarter would be expected to improve on average even without help, because part of any extreme result is chance. Showing participants the same pattern in data where no intervention took place is a memorable way to teach the point and the need for a comparison group.
Small subgroups. A survey of 1,000 customers shows that satisfaction among customers in one region fell by ten points. The region accounts for 40 respondents. A decision maker who knows to ask "how many people is that based on?" will treat the result as a signal to investigate, not a finding to act on.
Designing training that transfers
Much organisational training changes little. Baldwin and Ford (1988) reviewed research on the transfer of training, the extent to which what is learned is applied at work, and identified three groups of factors: the characteristics of trainees, the design of training, and the work environment, including whether managers support and reward the use of new skills. Blume et al. (2010) combined many studies in a meta-analysis and found that transfer was stronger when trainees were motivated and when the work environment supported the use of new skills. Arthur et al. (2003) found in a meta-analysis that organisational training generally had moderate to large effects on learning and behaviour, but that effects depended on the match between training methods and the skills being taught.
Several principles from research on learning apply.
Use real examples. Knowles (1980) argued that adults learn best when material is relevant to problems they face. Training built on the organisation's own reports, dashboards and decisions is more engaging and more likely to transfer than generic textbook examples.
Combine principles with examples. Fong et al. (1986) found that rules taught with concrete examples transferred better than either alone.
Practise with feedback. Kolb (1984) described learning as a cycle of experience, reflection, conceptualisation and experimentation. Hogarth (2001) argued that good intuitive judgement develops in environments with accurate, timely feedback, and that training should create such environments. Exercises in which participants make judgements about real data and then see how they compare with the correct answer provide this feedback.
Test, do not just tell. Roediger and Karpicke (2006) found that practising retrieval of material through tests produced much better long-term retention than studying it again. Short quizzes and exercises are more effective than lectures.
Space the learning. Cepeda et al. (2006) reviewed hundreds of studies and found that spreading learning over several sessions produces better retention than concentrating it in one. A series of short sessions, perhaps an hour each over several weeks, is likely to be more effective than a single day.
Change the environment, not only the individual. If decision makers are trained to ask good questions but meetings never leave time for them, or reports never include the information needed to answer them, the training will fade. Building the standard questions into templates, meeting agendas and approval processes makes their use routine.
Evaluating the training
Kirkpatrick and Kirkpatrick (2006) described four levels at which training can be evaluated: reaction (did participants find it useful?), learning (did they acquire the knowledge and skills?), behaviour (do they apply them at work?), and results (did the organisation's outcomes improve?).
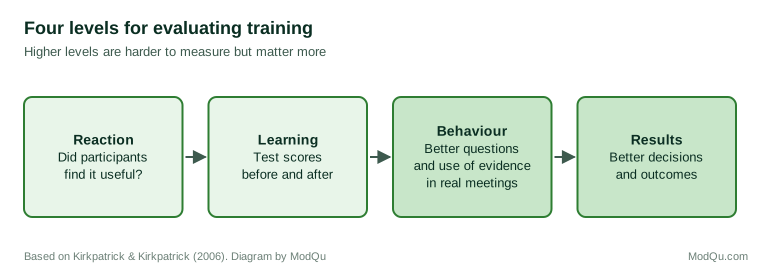
For insight literacy, learning can be measured with short tests of interpretation and reasoning before and after training, using items similar to those in validated instruments such as the Berlin Numeracy Test. Behaviour can be assessed by reviewing whether decision documents include the information the standard questions require, or by asking analysts whether the questions they receive have changed. Results are hardest to measure, but proxies include the number of initiatives tested before full rollout and the share of decisions that cite evidence.
A sample programme
A programme for senior and middle managers might run as four sessions of about 90 minutes, spaced two weeks apart, each built around the organisation's own material.
Session 1: Reading the evidence. Participants interpret a set of charts and tables taken from recent internal reports, write down what each shows, and compare their readings. Common errors, such as misreading scales or confusing percentages and percentage points, are discussed and corrected. Participants practise converting probabilities into natural frequencies.
Session 2: Uncertainty and variation. Using the organisation's own weekly sales or satisfaction data, participants try to distinguish real changes from normal variation, then see how often apparently notable movements were noise. The session introduces margins of error, sample size and regression to the mean.
Session 3: Cause and evidence quality. Participants examine claims from recent business cases, such as "the new campaign increased sales", and identify alternative explanations and the evidence that would rule them out. The session covers comparison groups, selection, and the difference between correlation and causation.
Session 4: Asking good questions. Participants practise using the standard questions on a live analysis presented by an analyst, then discuss how the questions changed their understanding. The session ends with each participant identifying one upcoming decision where they will apply the questions.
Each session begins with a short quiz on the previous one, and participants receive a one-page summary of the standard questions to keep. A follow-up a month after the final session asks participants and analysts what has changed.
Overcoming reluctance
Senior people may be reluctant to attend training that implies they do not understand numbers. Framing helps. Training can be presented as improving decision quality rather than correcting a deficit, kept short, built around real decisions, and led by people the participants respect. Starting with an exercise in which almost everyone makes the same mistake, such as a classic regression to the mean problem, shows that the difficulties are common and not a sign of personal weakness. Having the most senior leader attend the first session signals that the skills matter.
The role of the insight team
Insight teams are well placed to lead this training, because they know the organisation's data and the misunderstandings that recur. Training also benefits the insight team directly: decision makers who understand evidence ask better questions, value careful analysis more and are less likely to be swayed by overconfident claims from elsewhere. But insight teams must also adapt their own communication, because training does not remove the need for clear presentation. The two efforts work together: clearer communication lowers the skill required to understand insight, and better skills allow decision makers to engage with more sophisticated evidence.
Key takeaways
Insight literacy is the ability of decision makers who are not analysts to read evidence, reason about uncertainty, judge evidence quality, spot common traps and ask good questions. Many educated professionals lack these skills, with real costs for decisions. Research shows that statistical reasoning and judgement can be taught, especially when principles are combined with examples, information is represented as natural frequencies, training includes practice with feedback, and debiasing is explicit. Training transfers best when it uses real examples, tests and spaces learning, and is supported by changes to templates, meetings and processes. Evaluation should look beyond participants' reactions to learning, behaviour and results.
References
Arthur, W., Jr., Bennett, W., Jr., Edens, P. S., & Bell, S. T. (2003). Effectiveness of training in organizations: A meta-analysis of design and evaluation features. Journal of Applied Psychology, 88(2), 234–245. https://doi.org/10.1037/0021-9010.88.2.234
Baldwin, T. T., & Ford, J. K. (1988). Transfer of training: A review and directions for future research. Personnel Psychology, 41(1), 63–105. https://doi.org/10.1111/j.1744-6570.1988.tb00632.x
Belia, S., Fidler, F., Williams, J., & Cumming, G. (2005). Researchers misunderstand confidence intervals and standard error bars. Psychological Methods, 10(4), 389–396. https://doi.org/10.1037/1082-989X.10.4.389
Blume, B. D., Ford, J. K., Baldwin, T. T., & Huang, J. L. (2010). Transfer of training: A meta-analytic review. Journal of Management, 36(4), 1065–1105. https://doi.org/10.1177/0149206309352880
Brynjolfsson, E., Hitt, L. M., & Kim, H. H. (2011). Strength in numbers: How does data-driven decisionmaking affect firm performance? (Working paper). SSRN. https://doi.org/10.2139/ssrn.1819486
Cepeda, N. J., Pashler, H., Vul, E., Wixted, J. T., & Rohrer, D. (2006). Distributed practice in verbal recall tasks: A review and quantitative synthesis. Psychological Bulletin, 132(3), 354–380. https://doi.org/10.1037/0033-2909.132.3.354
Cokely, E. T., Galesic, M., Schulz, E., Ghazal, S., & Garcia-Retamero, R. (2012). Measuring risk literacy: The Berlin Numeracy Test. Judgment and Decision Making, 7(1), 25–47.
Davenport, T. H., & Harris, J. G. (2007). Competing on analytics: The new science of winning. Harvard Business School Press.
Fong, G. T., Krantz, D. H., & Nisbett, R. E. (1986). The effects of statistical training on thinking about everyday problems. Cognitive Psychology, 18(3), 253–292. https://doi.org/10.1016/0010-0285(86)90001-0
Gal, I. (2002). Adults' statistical literacy: Meanings, components, responsibilities. International Statistical Review, 70(1), 1–25. https://doi.org/10.1111/j.1751-5823.2002.tb00336.x
Galesic, M., & Garcia-Retamero, R. (2011). Graph literacy: A cross-cultural comparison. Medical Decision Making, 31(3), 444–457. https://doi.org/10.1177/0272989X10373805
Gigerenzer, G., & Hoffrage, U. (1995). How to improve Bayesian reasoning without instruction: Frequency formats. Psychological Review, 102(4), 684–704. https://doi.org/10.1037/0033-295X.102.4.684
Gigerenzer, G., Gaissmaier, W., Kurz-Milcke, E., Schwartz, L. M., & Woloshin, S. (2007). Helping doctors and patients make sense of health statistics. Psychological Science in the Public Interest, 8(2), 53–96. https://doi.org/10.1111/j.1539-6053.2008.00033.x
Hoffrage, U., Lindsey, S., Hertwig, R., & Gigerenzer, G. (2000). Communicating statistical information. Science, 290(5500), 2261–2262. https://doi.org/10.1126/science.290.5500.2261
Hogarth, R. M. (2001). Educating intuition. University of Chicago Press.
Kirkpatrick, D. L., & Kirkpatrick, J. D. (2006). Evaluating training programs: The four levels (3rd ed.). Berrett-Koehler.
Knowles, M. S. (1980). The modern practice of adult education: From pedagogy to andragogy (Rev. ed.). Cambridge Adult Education.
Kolb, D. A. (1984). Experiential learning: Experience as the source of learning and development. Prentice-Hall.
Lehman, D. R., Lempert, R. O., & Nisbett, R. E. (1988). The effects of graduate training on reasoning: Formal discipline and thinking about everyday-life events. American Psychologist, 43(6), 431–442. https://doi.org/10.1037/0003-066X.43.6.431
Lipkus, I. M., Samsa, G., & Rimer, B. K. (2001). General performance on a numeracy scale among highly educated samples. Medical Decision Making, 21(1), 37–44. https://doi.org/10.1177/0272989X0102100105
Mellers, B., Ungar, L., Baron, J., Ramos, J., Gurcay, B., Fincher, K., Scott, S. E., Moore, D., Atanasov, P., Swift, S. A., Murray, T., Stone, E., & Tetlock, P. E. (2014). Psychological strategies for winning a geopolitical forecasting tournament. Psychological Science, 25(5), 1106–1115. https://doi.org/10.1177/0956797614524255
Morewedge, C. K., Yoon, H., Scopelliti, I., Symborski, C. W., Korris, J. H., & Kassam, K. S. (2015). Debiasing decisions: Improved decision making with a single training intervention. Policy Insights from the Behavioral and Brain Sciences, 2(1), 129–140. https://doi.org/10.1177/2372732215600886
Roediger, H. L., III, & Karpicke, J. D. (2006). Test-enhanced learning: Taking memory tests improves long-term retention. Psychological Science, 17(3), 249–255. https://doi.org/10.1111/j.1467-9280.2006.01693.x
Schwartz, L. M., Woloshin, S., & Welch, H. G. (2009). Using a drug facts box to communicate drug benefits and harms: Two randomized trials. Annals of Internal Medicine, 150(8), 516–527. https://doi.org/10.7326/0003-4819-150-8-200904210-00106
Sedlmeier, P., & Gigerenzer, G. (2001). Teaching Bayesian reasoning in less than two hours. Journal of Experimental Psychology: General, 130(3), 380–400. https://doi.org/10.1037/0096-3445.130.3.380
Sellier, A.-L., Scopelliti, I., & Morewedge, C. K. (2019). Debiasing training improves decision making in the field. Psychological Science, 30(9), 1371–1379. https://doi.org/10.1177/0956797619861429
Tetlock, P. E., & Gardner, D. (2015). Superforecasting: The art and science of prediction. Crown.
Wolff, A., Gooch, D., Cavero Montaner, J. J., Rashid, U., & Kortuem, G. (2016). Creating an understanding of data literacy for a data-driven society. The Journal of Community Informatics, 12(3), 9–26.