
Insights · Communicating insight
Visual Encoding Choices That Enhance or Hinder Insight Perception
How specific design choices in charts, including the visual channel, pre-attentive features, grouping, aspect ratio, axis ranges, scales and colour maps, change what viewers notice and conclude, with evidence-based guidance for making insights visible.
Two charts can show exactly the same data and lead viewers to different conclusions. One makes a trend obvious; the other hides it. One draws the eye to the exception that matters; the other buries it among everything else. These differences come from encoding choices: decisions about which visual properties represent which data, and how they are scaled and arranged. Research in perception and visualisation has shown that many of these choices have predictable effects on what people see. This article reviews the most important ones and what they mean for presenting insight.
Visual channels differ in precision
Bertin (1983) described the visual variables available to a chart designer, such as position, size, shape, value, colour, orientation and texture, and argued that each suits some kinds of data better than others. Cleveland and McGill (1984) tested how accurately people judge quantities shown through different channels and found that position along a common scale was read most accurately, followed by length, angle, area and colour intensity. Heer and Bostock (2010) confirmed a similar ranking in larger online experiments. Franconeri et al. (2021) reviewed the science of visual data communication and concluded that these differences are robust and should guide the choice of encoding when precise comparison matters.
Some features are seen before attention
The visual system detects certain features almost instantly, before conscious attention. Treisman and Gelade (1980) found that an object differing from its neighbours in a single feature, such as colour, "pops out" and is found equally quickly however many other objects are present. An object defined by a combination of features, such as a green square among green circles and grey squares, must be searched for one item at a time. Healey and Enns (2012) reviewed how these findings apply to visualisation and identified features that are processed this way, including colour, size, orientation and motion.
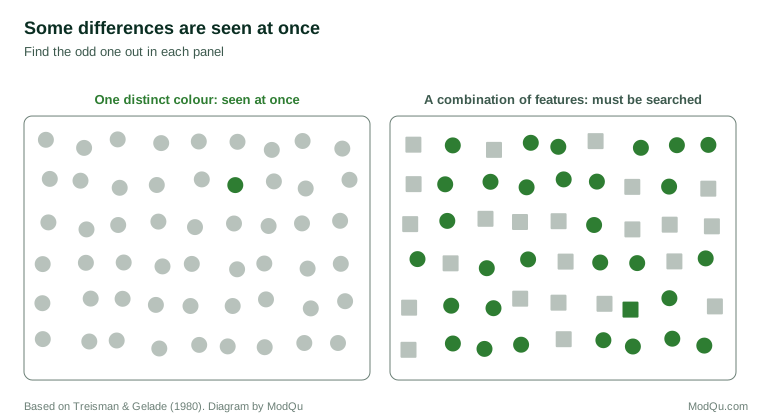
For insight, this means that the one point that matters should differ from the rest in a single strong feature, usually colour, while everything else is muted. Charts in which every series has a different bright colour remove this advantage, because nothing stands out. Pop-out also works against the designer: an unimportant element in a strong colour, such as a brightly coloured logo or gridline, draws the eye before the data do.
Grouping shapes what is compared
People perceive elements that are close together, similar in colour or connected by lines as belonging together. Wagemans et al. (2012) reviewed a century of research on these grouping principles. In charts, grouping determines which comparisons are easy. In a grouped bar chart, the bars placed next to each other are compared most readily. Placing the two values that the insight concerns side by side, in contrasting colours, makes the comparison obvious; placing them in separate groups makes it hard.
Bars and lines also suggest different relationships. Zacks and Tversky (1999) found that people tended to describe data shown as bars in terms of discrete comparisons ("A is higher than B") and data shown as lines in terms of trends ("it rises from A to B"), even when the data were the same. A line connecting categories that have no natural order can therefore suggest a trend that does not exist.
Aspect ratio changes perceived trends
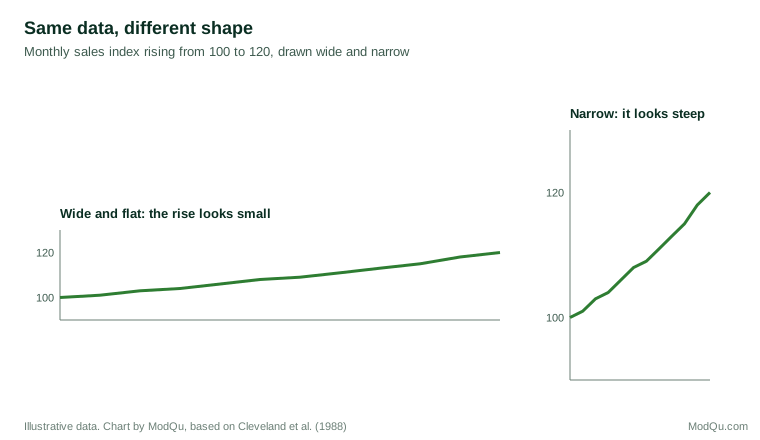
The shape of a chart affects how steep a trend looks. Cleveland et al. (1988) showed that judgements of slope are most accurate when the important line segments are oriented at around 45 degrees, and proposed choosing the aspect ratio of a chart accordingly, a technique known as "banking to 45 degrees". A wide, short chart flattens trends; a tall, narrow one exaggerates them.
Axis ranges change perceived effects
Whether an axis starts at zero changes how large a difference appears. Pandey et al. (2015) found that truncated axes led viewers to judge differences as substantially larger. Correll et al. (2020) found that truncating the vertical axis exaggerated perceived effect sizes for both bar and line charts, and that the effect persisted even when the truncation was clearly marked, although marking reduced it. They concluded that the choice of axis range should be deliberate: for bar charts, whose length encodes the value, starting at zero is usually necessary; for line charts, which encode change, a range that shows the variation may be appropriate, but the viewer should be told.
Scales can be misread
Logarithmic scales are useful for data that span several orders of magnitude, but they are often misunderstood. Menge et al. (2018) found that even ecologists frequently misinterpreted graphs with logarithmic axes, for example judging a curve on a log scale as levelling off when the underlying quantity was still rising rapidly. When a log scale is necessary, it should be labelled clearly and explained.
Colour maps
For data shown through colour, the colour map matters. Borland and Taylor (2007) argued that the "rainbow" colour map, which runs through the spectrum from blue to red, is misleading because it is not perceptually ordered: viewers cannot reliably tell whether yellow is more or less than cyan, and sharp boundaries appear between colours where the data change smoothly. Crameri et al. (2020) reviewed the misuse of colour in science communication and recommended perceptually uniform colour maps, in which equal steps in the data appear as equal steps in colour, and which remain readable for people with colour vision deficiency.
Parts of a whole
Pie charts are widely criticised, but the evidence is more nuanced. Spence and Lewandowsky (1991) found that people judged proportions from pie charts about as accurately as from bar charts, and more accurately for some comparisons involving combinations of parts. Simkin and Hastie (1987) found that the accuracy of different chart types depended on the judgement required: pie charts supported part-to-whole judgements well, while bar charts were better for comparing separate values. The choice should depend on the question the viewer needs to answer.
Order and labelling
The order in which categories appear also shapes what viewers see. Bars sorted by value make rankings and gaps obvious; bars in alphabetical or arbitrary order force viewers to search. Where categories have a natural order, such as age groups or stages of a process, that order should usually be kept. Otherwise, sorting by the value that matters to the insight is usually best.
Labels placed directly on the data are easier to use than legends, which require viewers to look back and forth and hold colour meanings in memory. Franconeri et al. (2021) noted that working memory can hold only a few items at once, so every lookup between a legend and the data adds effort and the risk of error.
An example
Consider a hypothetical chart prepared to show that one of eight regions has fallen behind the others in online sales growth. The first version is a line chart with eight brightly coloured lines, a legend in alphabetical order, a vertical axis starting at zero and a wide, flat shape. The struggling region's line is red, but so is another region's line in a slightly different shade. Viewers see a tangle of lines and cannot find the point.
The revised version shows seven regions in light grey and the struggling region in a single strong colour, labelled directly at the end of its line. The aspect ratio is adjusted so that the divergence over the last six months is clearly visible, and the title states the finding. The same data now make the insight visible within a few seconds, without any change to the numbers or the scale.
Practical guidance
- Encode the key comparison with position or length.
- Make the insight pop out with a single distinct colour against muted context.
- Place compared values together and use grouping deliberately.
- Use lines only for ordered data, such as time.
- Choose the aspect ratio so that important trends are neither flattened nor exaggerated.
- Start bar charts at zero, and mark and justify any truncated axis on line charts.
- Explain logarithmic scales or avoid them for general audiences.
- Use perceptually ordered colour maps, not rainbows, for continuous data.
- Match the chart to the question: parts of a whole, comparisons and trends call for different encodings.
- Sort categories by value unless they have a natural order, and label data directly rather than relying on a legend.
Key takeaways
Encoding choices determine what viewers notice and conclude. Position and length support the most accurate judgements. Features such as colour are seen before attention, so a single distinct colour can make an insight stand out. Grouping, chart type, aspect ratio, axis range, scale and colour map all change perceived comparisons, trends and effect sizes, often substantially. Deliberate, evidence-based encoding choices make insights visible without distorting them.
References
Bertin, J. (1983). Semiology of graphics: Diagrams, networks, maps (W. J. Berg, Trans.). University of Wisconsin Press.
Borland, D., & Taylor, R. M., II. (2007). Rainbow color map (still) considered harmful. IEEE Computer Graphics and Applications, 27(2), 14–17. https://doi.org/10.1109/MCG.2007.323435
Cleveland, W. S., & McGill, R. (1984). Graphical perception: Theory, experimentation, and application to the development of graphical methods. Journal of the American Statistical Association, 79(387), 531–554. https://doi.org/10.1080/01621459.1984.10478080
Cleveland, W. S., McGill, M. E., & McGill, R. (1988). The shape parameter of a two-variable graph. Journal of the American Statistical Association, 83(402), 289–300. https://doi.org/10.1080/01621459.1988.10478598
Correll, M., Bertini, E., & Franconeri, S. (2020). Truncating the y-axis: Threat or menace? In Proceedings of the 2020 CHI Conference on Human Factors in Computing Systems (pp. 1–12). ACM. https://doi.org/10.1145/3313831.3376222
Crameri, F., Shephard, G. E., & Heron, P. J. (2020). The misuse of colour in science communication. Nature Communications, 11, Article 5444. https://doi.org/10.1038/s41467-020-19160-7
Franconeri, S. L., Padilla, L. M., Shah, P., Zacks, J. M., & Hullman, J. (2021). The science of visual data communication: What works. Psychological Science in the Public Interest, 22(3), 110–161. https://doi.org/10.1177/15291006211051956
Healey, C. G., & Enns, J. T. (2012). Attention and visual memory in visualization and computer graphics. IEEE Transactions on Visualization and Computer Graphics, 18(7), 1170–1188. https://doi.org/10.1109/TVCG.2011.127
Heer, J., & Bostock, M. (2010). Crowdsourcing graphical perception: Using Mechanical Turk to assess visualization design. In Proceedings of the SIGCHI Conference on Human Factors in Computing Systems (pp. 203–212). ACM. https://doi.org/10.1145/1753326.1753357
Menge, D. N. L., MacPherson, A. C., Bytnerowicz, T. A., Quebbeman, A. W., Schwartz, N. B., Taylor, B. N., & Wolf, A. A. (2018). Logarithmic scales in ecological data presentation may cause misinterpretation. Nature Ecology & Evolution, 2(9), 1393–1402. https://doi.org/10.1038/s41559-018-0610-7
Pandey, A. V., Rall, K., Satterthwaite, M. L., Nov, O., & Bertini, E. (2015). How deceptive are deceptive visualizations? An empirical analysis of common distortion techniques. In Proceedings of the 33rd Annual ACM Conference on Human Factors in Computing Systems (pp. 1469–1478). ACM. https://doi.org/10.1145/2702123.2702608
Simkin, D., & Hastie, R. (1987). An information-processing analysis of graph perception. Journal of the American Statistical Association, 82(398), 454–465. https://doi.org/10.1080/01621459.1987.10478448
Spence, I., & Lewandowsky, S. (1991). Displaying proportions and percentages. Applied Cognitive Psychology, 5(1), 61–77. https://doi.org/10.1002/acp.2350050106
Treisman, A. M., & Gelade, G. (1980). A feature-integration theory of attention. Cognitive Psychology, 12(1), 97–136. https://doi.org/10.1016/0010-0285(80)90005-5
Wagemans, J., Elder, J. H., Kubovy, M., Palmer, S. E., Peterson, M. A., Singh, M., & von der Heydt, R. (2012). A century of Gestalt psychology in visual perception: I. Perceptual grouping and figure–ground organization. Psychological Bulletin, 138(6), 1172–1217. https://doi.org/10.1037/a0029333
Zacks, J., & Tversky, B. (1999). Bars and lines: A study of graphic communication. Memory & Cognition, 27(6), 1073–1079. https://doi.org/10.3758/BF03201236