
Insights · Generating insight
Techniques for Generating Insights From Survey Data
Practical analytic techniques for moving from survey tables to insight, including exploration, subgroup comparison, driver analysis, importance-performance mapping and coding of open-ended answers, with the checks that keep conclusions sound.
A completed survey produces a large volume of numbers: percentages for every question, broken down by every demographic group. Insight rarely sits in any single table. It emerges when the analyst looks across questions and groups, asks why patterns occur, and connects the results to a decision. The techniques below help turn survey data into insight.
Start from the question
Analysis should begin with the decision the survey was meant to inform and the questions that decision raises. Listing three to five analytic questions before opening the data keeps the work focused and reduces the temptation to search through every possible table for something interesting.
Explore before testing
Tukey (1977) argued that data should first be explored, through simple displays of distributions and relationships, before formal tests are applied. In survey analysis this means examining the full distribution of answers, not only averages. A mean satisfaction score of 7 out of 10 could reflect most customers scoring 7 or a split between delighted and very unhappy customers, which call for very different responses. Charts that show position along a common scale, such as dot plots and bar charts, are read more accurately than pie charts or area-based displays (Cleveland & McGill, 1984).
Compare subgroups, carefully
Comparing results across customer groups is the most common source of survey insight: which segments are most satisfied, which most likely to leave, which most interested in a new offer. Two cautions apply. First, small subgroups produce unstable estimates, so differences should be judged against their margin of error. Second, an overall pattern can reverse within subgroups, a phenomenon known as Simpson's paradox (Simpson, 1951). Bickel et al. (1975) described a famous case in which a university's overall admission figures suggested bias against women, yet within most departments women were admitted at similar or higher rates; the overall pattern arose because women applied more often to departments with low admission rates for everyone. In survey data, a result that differs between groups should be checked against other variables that might explain it.
Identify what drives outcomes
Managers often want to know which aspects of a product or service most affect overall satisfaction or loyalty. Asking customers directly what is important tends to produce answers in which everything matters. Driver analysis instead estimates importance statistically, by relating ratings of individual attributes to an overall outcome. Because attribute ratings are usually correlated with each other, simple regression weights can be misleading; relative weight methods divide the explained variance among correlated predictors in a more stable way (Johnson, 2000).
Map importance against performance
Importance-performance analysis, introduced by Martilla and James (1977), plots each attribute by its importance and by how well the organisation performs on it. The resulting grid points to priorities: attributes that matter a great deal but perform poorly need attention, while attributes that perform well but matter little may be receiving more resources than they deserve.
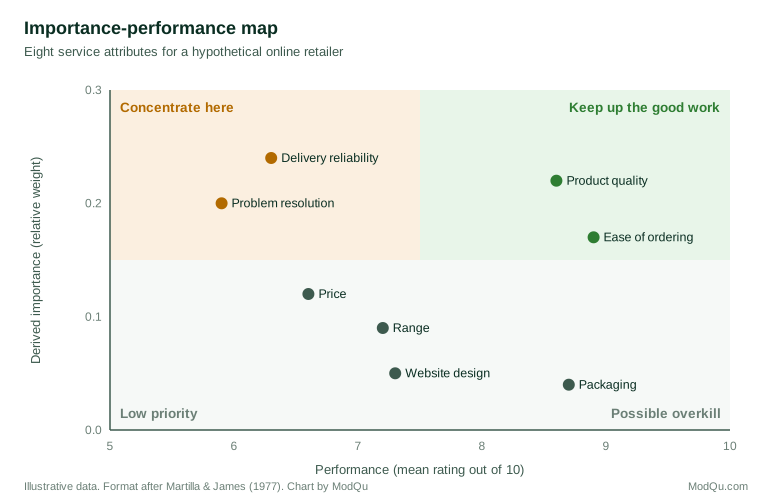
In the example shown, delivery reliability and problem resolution have the highest derived importance but below-average performance, so they are the clearest priorities. Product quality and ease of ordering also matter a great deal and already perform well, so the task there is to maintain standards. Packaging performs well but has little effect on overall satisfaction, which suggests that further spending on it is unlikely to improve loyalty. The quadrant boundaries are a matter of judgement, often set at the mean of each axis, so attributes near a boundary deserve a closer look rather than automatic assignment to a quadrant.
Use the open-ended answers
Open-ended responses explain the numbers. Coding them into themes, and then comparing theme frequencies across groups, often reveals why a score is low. A few well-chosen verbatim quotes also make findings concrete for decision makers.
Guard against chance findings
A survey with many questions and many subgroups allows hundreds of comparisons, and some will appear significant by chance. Gelman and Loken (2014) showed that this problem arises even without deliberate searching, because analysts make many reasonable choices after seeing the data. Focusing on the questions defined in advance, treating unexpected findings as hypotheses to be confirmed, and looking for patterns that recur across related questions all reduce the risk.
From finding to insight
A finding becomes an insight when it explains something about customers that matters for a decision. The final step is to ask of each result: why might this be so, what else in the data supports that explanation, and what should we do differently as a result?
References
Bickel, P. J., Hammel, E. A., & O'Connell, J. W. (1975). Sex bias in graduate admissions: Data from Berkeley. Science, 187(4175), 398–404. https://doi.org/10.1126/science.187.4175.398
Cleveland, W. S., & McGill, R. (1984). Graphical perception: Theory, experimentation, and application to the development of graphical methods. Journal of the American Statistical Association, 79(387), 531–554. https://doi.org/10.1080/01621459.1984.10478080
Gelman, A., & Loken, E. (2014). The statistical crisis in science. American Scientist, 102(6), 460–465. https://doi.org/10.1511/2014.111.460
Johnson, J. W. (2000). A heuristic method for estimating the relative weight of predictor variables in multiple regression. Multivariate Behavioral Research, 35(1), 1–19. https://doi.org/10.1207/S15327906MBR3501_1
Martilla, J. A., & James, J. C. (1977). Importance-performance analysis. Journal of Marketing, 41(1), 77–79. https://doi.org/10.1177/002224297704100112
Simpson, E. H. (1951). The interpretation of interaction in contingency tables. Journal of the Royal Statistical Society: Series B (Methodological), 13(2), 238–241. https://doi.org/10.1111/j.2517-6161.1951.tb00088.x
Tukey, J. W. (1977). Exploratory data analysis. Addison-Wesley.