
Insights · Customer and market insight
Pricing Insight and Willingness to Pay
How organisations can understand what customers are willing to pay, covering why price matters so much to profit, the psychology of price perception, survey, choice-based and incentive-aligned methods for measuring willingness to pay, the evidence on their accuracy, and the role of field experiments.
Price is the marketing decision with the most direct effect on profit, and often the one made with the least evidence. Many organisations set prices by adding a margin to costs, matching competitors or following habit, without a clear view of what customers would be willing to pay. Pricing insight aims to change that, by understanding how customers perceive prices, how much they value what is offered, and how demand would respond to different prices. This article reviews why pricing insight matters, what research shows about how people think about price, and the methods available for measuring willingness to pay, with their strengths and weaknesses.
Why price matters
Small changes in price can have large effects on profit. Marn and Rosiello (1992) analysed the cost structures of a large number of companies and calculated that, for an average company, a 1% improvement in price, with volume unchanged, would increase operating profit by about 11%, a larger effect than equivalent improvements in volume or in variable or fixed costs. The calculation depends on the assumption that volume does not fall, which is exactly what pricing insight must test, but it shows why getting price right is so valuable.
How much demand changes with price, the price elasticity, varies widely. Tellis (1988) conducted a meta-analysis of econometric studies and found an average price elasticity of about −2, meaning that a 1% increase in price was associated on average with about a 2% decrease in sales, with substantial variation between products and studies. Bijmolt et al. (2005) updated this work with a larger set of studies and found a similar average elasticity of about −2.6, again with wide variation depending on the product category, the stage of the product life cycle and the method used. Averages like these are a starting point, not an answer: the elasticity for a particular product and market must be estimated directly.
How customers perceive price
Willingness to pay is not a fixed number stored in a customer's mind. It depends on how prices are presented, what they are compared with and what the price itself signals.
Reference prices and fairness. Customers judge prices against reference points, such as the price they paid last time, the price of competitors or what they consider fair. Thaler (1985) described how consumers evaluate purchases partly through "transaction utility", the perceived value of the deal relative to a reference price, in addition to the value of the product itself. Kahneman et al. (1986) surveyed members of the public and found that many considered it unfair for firms to raise prices in response to increased demand, such as raising the price of snow shovels after a snowstorm, while price increases that reflected higher costs were seen as acceptable. Perceived unfairness can provoke resentment and lost custom even when customers would be willing to pay more.
Price as a signal of quality. Price can affect how good a product seems. Gabor and Granger (1966) found that many shoppers would reject products priced too low because they suspected poor quality. Rao and Monroe (1989) reviewed experimental studies and found a positive relationship between price and perceived quality, which was stronger in some conditions than others. Shiv et al. (2005) found that participants who paid a discounted price for an energy drink solved fewer puzzles afterwards than those who paid full price, suggesting that price expectations can even affect how well a product appears to work.
Arbitrary anchors. Ariely et al. (2003) asked participants to write down the last two digits of their social security number and then to state whether they would pay that amount for various products, before stating their maximum willingness to pay. Participants with higher numbers stated substantially higher willingness to pay, although their relative valuations of different products were consistent. Willingness to pay, on this evidence, can be strongly influenced by arbitrary starting points.
Presentation. The way a price is shown affects how it is perceived. Thomas and Morwitz (2005) found that prices ending in 99, such as 2.99, were perceived as lower than prices a cent higher when the leftmost digit changed, a "left-digit effect". Anderson and Simester (2003) conducted field experiments with a mail-order catalogue and found that items priced with a 9 ending sold more than the same items priced slightly lower. Morwitz et al. (1998) found that "partitioned" prices, in which a surcharge such as shipping is shown separately from the base price, led consumers to recall a lower total cost and to show higher demand than when the same total was shown as a single price.
Price consciousness. Customers differ in how much attention they pay to price. Lichtenstein et al. (1993) identified several distinct price-related perceptions, including value consciousness, price consciousness, coupon proneness and the use of price as a sign of prestige, and found that they were related to different shopping behaviours. Pricing insight must therefore consider how customer segments differ, not only the average response.
Methods for measuring willingness to pay
Many methods exist for measuring willingness to pay. Breidert et al. (2006) classified them by whether they observe actual purchases or rely on surveys, and whether they ask about price directly or infer it from choices.
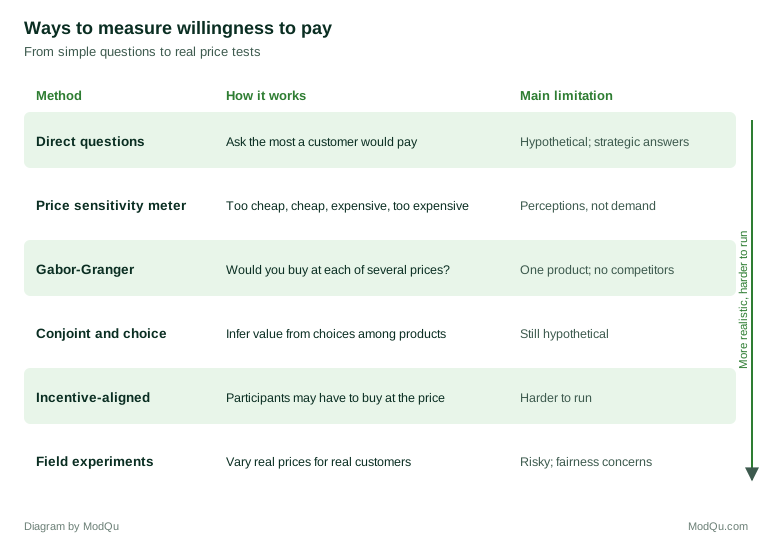
Direct questions. The simplest method is to ask customers the most they would pay. Such questions are easy to ask but tend to produce unreliable answers, because customers have rarely thought about the question, may answer strategically to keep prices low, and do not face the consequences of their answer.
Price sensitivity meter. Van Westendorp (1976) proposed asking four questions: at what price a product would be so cheap that its quality would be doubted, at what price it would be a bargain, at what price it would start to seem expensive, and at what price it would be too expensive to consider. Plotting the answers produces a range of acceptable prices. The method is popular because it is simple and shows how customers perceive prices, but it does not directly measure demand or allow for competitors.
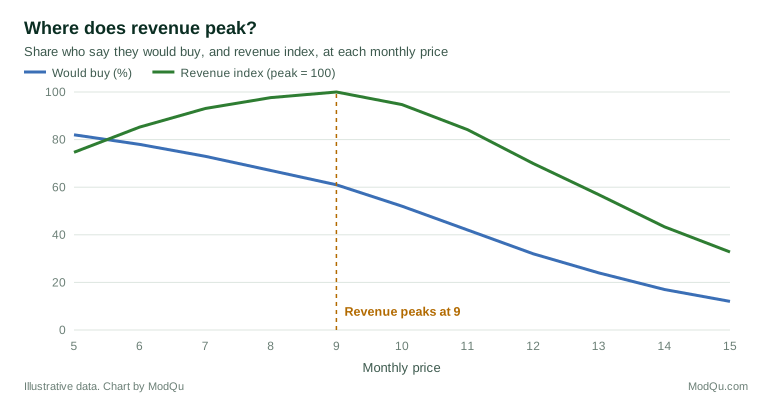
Gabor-Granger. Gabor and Granger (1966) developed a method in which respondents are asked whether they would buy a product at a series of prices. The share willing to buy at each price produces a demand curve, from which the revenue-maximising price can be estimated.
Conjoint analysis and choice experiments. Rather than asking about price directly, these methods present products described by combinations of attributes, including price, and ask respondents to rate or choose among them. Green and Srinivasan (1990) reviewed conjoint analysis in marketing, and Louviere and Woodworth (1983) developed choice-based experiments, which ask respondents to choose among alternatives as they would in a market. Because price is traded off against other attributes, and competing products can be included, these methods tend to give more realistic estimates than direct questions.
Incentive-aligned methods. The weakness of all survey methods is that answers have no consequences. Becker et al. (1964) developed a procedure in which a participant states a maximum price, a price is then drawn at random, and the participant must buy the product at the drawn price if it is below their stated maximum. Because the price paid does not depend on the stated amount, participants have an incentive to state their true willingness to pay. Wertenbroch and Skiera (2002) applied this procedure at the point of purchase and found that it produced lower and more realistic estimates of willingness to pay than direct questions.
Field experiments. The most direct evidence comes from varying actual prices for real customers and observing what they buy. Anderson and Simester (2003) used this approach with a catalogue, sending different versions to randomly selected customers. Online businesses can test prices in a similar way, although price tests raise concerns about fairness if customers discover that others were offered different prices for the same product.
How accurate are the methods?
Several studies have compared methods with actual behaviour. Miller et al. (2011) compared direct and indirect, hypothetical and incentive-aligned methods against real purchases, and found that hypothetical methods tended to overestimate willingness to pay, but that they could still lead to correct pricing decisions in some cases because the bias was similar across price levels. Schmidt and Bijmolt (2020) conducted a meta-analysis of studies comparing hypothetical and real willingness to pay for consumer goods and found that hypothetical methods overstated willingness to pay on average by around a fifth, with the size of the bias depending on the method and product.
The practical conclusions are that survey-based estimates should be treated as upper bounds or as measures of relative rather than absolute value; that choice-based methods are usually more realistic than direct questions; that incentive alignment improves accuracy where it is feasible; and that important pricing decisions should, where possible, be tested in the market.
Learning from transaction data
Organisations already hold a great deal of pricing evidence in their sales records: prices have changed over time, promotions have come and gone, and different stores or channels have charged different amounts. Analysing this history can reveal how demand has responded to price.
Such analysis needs care. Prices are rarely changed at random. They are often cut when demand is weak and raised when it is strong, or changed at the same time as advertising, distribution or competitors' prices. A simple comparison of sales at high and low prices may therefore confuse the effect of price with the effect of whatever prompted the price change. Bijmolt et al. (2005) found that estimated elasticities differed systematically depending on whether studies accounted for this problem. Good analysis controls for other influences, uses periods or places where prices changed for reasons unrelated to demand, and treats the results as estimates to be tested rather than as settled facts.
Promotions add a further complication. Temporary price cuts often produce large short-term increases in sales, but part of the increase comes from customers buying earlier or stocking up, and part from customers switching from other products in the same range. Repeated promotions can also lower the price customers regard as normal. Kalyanaram and Winer (1995) reviewed research on reference prices and concluded that consumers' reference prices are influenced by past prices, including promotional prices, and that prices above the reference price reduce demand more than prices below it increase it. An organisation that promotes frequently may find that customers wait for the next promotion rather than buying at the regular price.
Segments and price structures
Customers differ widely in what they are willing to pay, and a single price leaves value uncaptured: some customers would have paid more, and others who would have bought at a lower price do not buy at all. Price structures such as tiers, bundles, volume discounts and subscriptions allow organisations to serve customers with different willingness to pay. Shapiro and Varian (1998) described "versioning", offering several versions of a product with different features or performance at different prices, as a way of letting customers sort themselves according to how much they value the product.
Pricing insight supports such structures by identifying which features different segments value most, which features could be used to separate versions, and how customers would move between versions at different prices. Choice experiments are particularly useful here, because they can simulate how customers would choose among several versions and competing offers at once.
Price changes and fairness
Even when customers would be willing to pay more, the way a price increase is made affects how it is received. Campbell (1999) found that consumers judged a price increase as less fair when they inferred that the firm's motive was to increase profits rather than to cover higher costs, and that perceived unfairness reduced their intention to buy. Explaining the reason for a change, giving notice and protecting existing customers for a period can reduce the risk of resentment. Pricing research can test how customers are likely to react to different ways of presenting a change before it is made.
From insight to pricing decisions
Measuring willingness to pay is only part of pricing insight. Nagle and Müller (2018) argued that effective pricing is based on the value a product creates for customers, communicated in a way they understand, and supported by a pricing structure, such as tiers, bundles or subscriptions, that captures different customers' willingness to pay. Dolan (1995) described pricing as a process that begins with understanding how customers value the product and how they differ, and continues through the design of the price structure and the anticipation of competitors' reactions. Monroe (2003) emphasised that customers' perceptions of value, not costs, determine the upper limit of what can be charged, while costs determine the lower limit.
Insight therefore needs to address several questions. How do customers perceive the value of what is offered? How do segments differ in their willingness to pay and their sensitivity to price? What do they compare the price with? How will they perceive the fairness of a change? And how will competitors respond?
An example
Consider a hypothetical software company planning to introduce a premium tier of its project management product. A direct survey suggests that many customers would pay 30 a month for the premium features. A choice experiment, in which customers choose between the current product, the premium tier at different prices and competing products, gives a more cautious picture: the share choosing the premium tier falls steeply above 20, and many customers prefer to pay for one specific feature rather than the whole bundle.
The company runs a field test with a sample of new customers, offering the premium tier at 18, 22 or 26. Take-up at 26 is low, while the difference between 18 and 22 is small, so revenue is highest at 22. Interviews with customers who declined suggest that the feature they value most is advanced reporting. The company launches the premium tier at 22 and offers advanced reporting as a separate add-on for customers who want only that feature. The survey estimate of 30 would have priced most customers out. The company also plans to repeat the test a year later, because willingness to pay is likely to change as the product and its competitors develop.
Common mistakes
Several mistakes recur in pricing research. Taking stated willingness to pay at face value leads to prices that are too high, because hypothetical answers usually overstate what customers will actually pay. Asking about price in isolation, without the competing products customers would consider, misses the comparison that drives real decisions. Averaging across all customers hides the segments that are most and least sensitive to price, which are often the most important for setting price structures. Ignoring how prices will be presented, with their endings, partitions and reference points, overlooks effects that can be as large as the price difference itself. And treating a single study as definitive, rather than as one input to be checked against transaction data and market tests, makes pricing decisions more fragile than they need to be.
A sound programme of pricing insight therefore combines methods. Qualitative research explores how customers think about value and what they compare the price with. Choice experiments estimate trade-offs and simulate the effect of different price structures. Transaction data shows how demand has responded in the past. And carefully designed market tests confirm the most important decisions before they are applied to all customers.
Key takeaways
Price has a powerful effect on profit, and the response of demand to price varies widely between products and markets. Customers' willingness to pay depends on reference points, perceptions of fairness and quality, arbitrary anchors and how prices are presented. Methods for measuring willingness to pay range from direct questions and price sensitivity meters to choice experiments, incentive-aligned procedures and field experiments. Hypothetical methods tend to overstate willingness to pay, so their estimates should be interpreted with care and important decisions tested in the market. Pricing insight is most useful when it explains not only how much customers will pay, but why, and how this differs between them.
References
Anderson, E. T., & Simester, D. I. (2003). Effects of $9 price endings on retail sales: Evidence from field experiments. Quantitative Marketing and Economics, 1(1), 93–110. https://doi.org/10.1023/A:1023581927405
Ariely, D., Loewenstein, G., & Prelec, D. (2003). "Coherent arbitrariness": Stable demand curves without stable preferences. Quarterly Journal of Economics, 118(1), 73–106. https://doi.org/10.1162/00335530360535153
Becker, G. M., DeGroot, M. H., & Marschak, J. (1964). Measuring utility by a single-response sequential method. Behavioral Science, 9(3), 226–232. https://doi.org/10.1002/bs.3830090304
Bijmolt, T. H. A., van Heerde, H. J., & Pieters, R. G. M. (2005). New empirical generalizations on the determinants of price elasticity. Journal of Marketing Research, 42(2), 141–156. https://doi.org/10.1509/jmkr.42.2.141.62296
Breidert, C., Hahsler, M., & Reutterer, T. (2006). A review of methods for measuring willingness-to-pay. Innovative Marketing, 2(4), 8–32.
Campbell, M. C. (1999). Perceptions of price unfairness: Antecedents and consequences. Journal of Marketing Research, 36(2), 187–199. https://doi.org/10.1177/002224379903600204
Dolan, R. J. (1995). How do you know when the price is right? Harvard Business Review, 73(5), 174–183.
Gabor, A., & Granger, C. W. J. (1966). Price as an indicator of quality: Report on an enquiry. Economica, 33(129), 43–70. https://doi.org/10.2307/2552272
Green, P. E., & Srinivasan, V. (1990). Conjoint analysis in marketing: New developments with implications for research and practice. Journal of Marketing, 54(4), 3–19. https://doi.org/10.1177/002224299005400402
Kahneman, D., Knetsch, J. L., & Thaler, R. (1986). Fairness as a constraint on profit seeking: Entitlements in the market. American Economic Review, 76(4), 728–741.
Kalyanaram, G., & Winer, R. S. (1995). Empirical generalizations from reference price research. Marketing Science, 14(3, Suppl.), G161–G169. https://doi.org/10.1287/mksc.14.3.G161
Lichtenstein, D. R., Ridgway, N. M., & Netemeyer, R. G. (1993). Price perceptions and consumer shopping behavior: A field study. Journal of Marketing Research, 30(2), 234–245. https://doi.org/10.1177/002224379303000208
Louviere, J. J., & Woodworth, G. (1983). Design and analysis of simulated consumer choice or allocation experiments: An approach based on aggregate data. Journal of Marketing Research, 20(4), 350–367. https://doi.org/10.1177/002224378302000403
Marn, M. V., & Rosiello, R. L. (1992). Managing price, gaining profit. Harvard Business Review, 70(5), 84–94.
Miller, K. M., Hofstetter, R., Krohmer, H., & Zhang, Z. J. (2011). How should consumers' willingness to pay be measured? An empirical comparison of state-of-the-art approaches. Journal of Marketing Research, 48(1), 172–184. https://doi.org/10.1509/jmkr.48.1.172
Monroe, K. B. (2003). Pricing: Making profitable decisions (3rd ed.). McGraw-Hill/Irwin.
Morwitz, V. G., Greenleaf, E. A., & Johnson, E. J. (1998). Divide and prosper: Consumers' reactions to partitioned prices. Journal of Marketing Research, 35(4), 453–463. https://doi.org/10.1177/002224379803500404
Nagle, T. T., & Müller, G. (2018). The strategy and tactics of pricing: A guide to growing more profitably (6th ed.). Routledge.
Rao, A. R., & Monroe, K. B. (1989). The effect of price, brand name, and store name on buyers' perceptions of product quality: An integrative review. Journal of Marketing Research, 26(3), 351–357. https://doi.org/10.1177/002224378902600309
Schmidt, J., & Bijmolt, T. H. A. (2020). Accurately measuring willingness to pay for consumer goods: A meta-analysis of the hypothetical bias. Journal of the Academy of Marketing Science, 48(3), 499–518. https://doi.org/10.1007/s11747-019-00666-6
Shapiro, C., & Varian, H. R. (1998). Versioning: The smart way to sell information. Harvard Business Review, 76(6), 106–114.
Shiv, B., Carmon, Z., & Ariely, D. (2005). Placebo effects of marketing actions: Consumers may get what they pay for. Journal of Marketing Research, 42(4), 383–393. https://doi.org/10.1509/jmkr.2005.42.4.383
Tellis, G. J. (1988). The price elasticity of selective demand: A meta-analysis of econometric models of sales. Journal of Marketing Research, 25(4), 331–341. https://doi.org/10.1177/002224378802500401
Thaler, R. (1985). Mental accounting and consumer choice. Marketing Science, 4(3), 199–214. https://doi.org/10.1287/mksc.4.3.199
Thomas, M., & Morwitz, V. (2005). Penny wise and pound foolish: The left-digit effect in price cognition. Journal of Consumer Research, 32(1), 54–64. https://doi.org/10.1086/429600
Van Westendorp, P. H. (1976). NSS price sensitivity meter (PSM): A new approach to study consumer perception of prices. In Proceedings of the 29th ESOMAR Congress (pp. 139–167). ESOMAR.
Wertenbroch, K., & Skiera, B. (2002). Measuring consumers' willingness to pay at the point of purchase. Journal of Marketing Research, 39(2), 228–241. https://doi.org/10.1509/jmkr.39.2.228.19086