
Insights · Customer and market insight
Brand Insight: Perception, Positioning and Meaning
How to understand what a brand means to people, covering brand knowledge and equity, positioning and perceptual maps, the strong link between brand image and brand usage, salience, cultural meaning and qualitative methods, and how brand perceptions relate to business results.
A brand is more than a name and a logo. It is the set of associations, feelings and expectations that people hold about a product or organisation, built up through advertising, experience, word of mouth and culture. These perceptions influence which products people notice, which they consider, how they experience them and what they are willing to pay. Brand insight is the work of understanding these perceptions: what people know and feel about a brand, how it differs from competitors in their minds, what it means to them, and how all of this affects behaviour.
This article reviews the main ideas and evidence behind brand insight, the methods used to study brand perceptions, and some important cautions in interpreting them.
What brands are in the mind
Keller (1993) described customer-based brand equity as the differential effect that knowledge of a brand has on how consumers respond to its marketing. Keller defined brand knowledge in terms of two components: brand awareness, whether people can recognise and recall the brand, and brand image, the associations people hold about it. Associations can concern the brand's attributes, the benefits it provides and people's overall attitudes toward it, and they differ in how favourable, strong and unique they are. Aaker (1991) described brand equity as a set of assets, including awareness, perceived quality, associations and loyalty, that add to or subtract from the value a product provides.
Brands can change how products are experienced, not only how they are chosen. Allison and Uhl (1964) gave beer drinkers unlabelled and labelled bottles of several beers and found that, without labels, they could not reliably tell the beers apart, while with labels they rated their own usual brand more highly. McClure et al. (2004) found that knowing they were drinking Coca-Cola changed both participants' stated preferences and activity in brain regions associated with memory, compared with tasting without brand information. Brand perceptions, in other words, are part of the product experience itself.
Positioning
Positioning is the place a brand occupies in people's minds relative to competitors. Ries and Trout (1981) popularised the term and argued that, in crowded markets, brands succeed by owning a simple, distinct idea in consumers' minds. Park et al. (1986) argued that brands should be built around a clear concept, functional, symbolic or experiential, which guides all decisions about how the brand is presented over time.
Keller et al. (2002) described positioning in terms of points of parity, associations a brand must share with competitors to be a credible member of its category, and points of difference, associations that distinguish it and give people a reason to choose it. Brand insight helps identify both: what a brand must match to be considered at all, and where it can credibly stand apart.
Perceptual maps are a common way to display positioning. Hauser and Koppelman (1979) compared methods for building such maps from consumer judgements and found that they differed in accuracy and in how easily managers could interpret them. Maps can also be built from text: Netzer et al. (2012) used online discussions to map how consumers grouped car brands, and found that the resulting maps were broadly consistent with those from survey data.
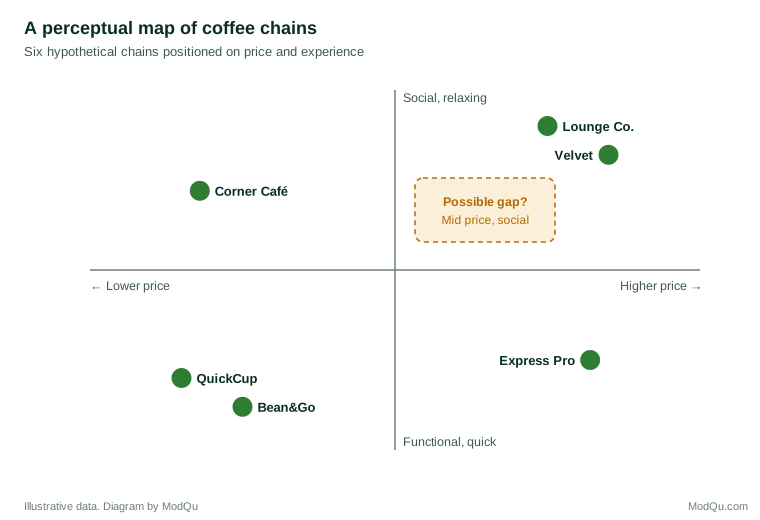
A gap on a perceptual map is a hypothesis, not a conclusion. There may be no brand in a position because few consumers want it, or because it is hard to deliver profitably. Testing whether demand exists requires further research, for example a survey of the size and characteristics of the group that would want such a brand, or a concept test that measures interest in a specific offer aimed at that position. Maps also depend on the dimensions chosen to draw them, and a brand that looks undifferentiated on price and experience may be clearly distinct on another dimension that matters to buyers.
Brand image and brand usage
One of the most consistent findings in brand research is that people who use a brand are more likely to associate it with almost any positive attribute. Bird et al. (1970) found that the proportion of people associating a brand with a given attribute was strongly related to how many people used the brand. Romaniuk et al. (2012) re-examined this pattern four decades later across many categories and found that it still held: users of a brand were much more likely than non-users to link it to attributes, and bigger brands therefore tended to score higher on most attributes.
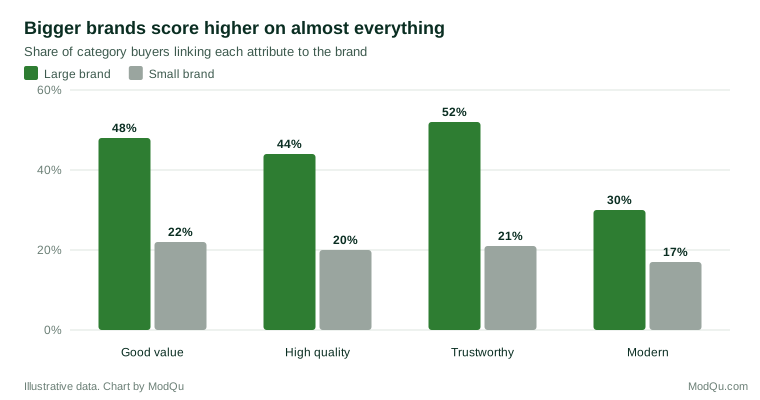
This has important implications for interpreting brand surveys. If a large brand scores higher than a small one on "high quality", this may reflect nothing more than the fact that more people use it. To find out what is distinctive about a brand, analysts need to compare its scores with what would be expected given its size, or compare users of different brands with each other. The same logic underlies "double jeopardy", described by Ehrenberg et al. (1990): smaller brands not only have fewer buyers, but those buyers also tend to buy them slightly less often and to be slightly less loyal, so that small brands suffer twice.
Salience and mental availability
Some researchers argue that the most important brand perception is simply whether a brand comes to mind in buying situations. Romaniuk and Sharp (2004) described brand salience as the propensity of a brand to be noticed or thought of in buying situations, and argued that it depends on the number and strength of links between the brand and the cues people encounter, such as the occasion, the need or the location. Sharp (2010) argued, drawing on empirical patterns of buying behaviour, that brands grow mainly by increasing the number of people who buy them, which requires being easy to think of and easy to buy, rather than by deepening the loyalty of existing customers.
For brand insight, this suggests measuring not only what people think about a brand when prompted, but how readily it comes to mind in response to the situations in which people buy, for example by asking which brands people think of for a particular occasion or need.
Distinctive brand assets
Brands are recognised not only by their names but by colours, logos, shapes, characters, sounds and slogans. Romaniuk (2018) described these as distinctive brand assets and argued that an asset is valuable only to the extent that it is both widely linked to the brand and uniquely linked to it, so that people who see it think of that brand and no other. A colour shared by several competitors is not distinctive, however strongly one brand uses it.
Measuring distinctiveness is straightforward in principle. Category buyers are shown each asset without the brand name and asked which brand, if any, it belongs to. The share who name the correct brand measures the asset's reach; the share naming other brands measures its confusion with competitors. Assets that score well on both can be used to make advertising and packaging more recognisable, while assets that are weak or shared may need to be strengthened or dropped. Such research is especially useful before a redesign, when a brand risks discarding assets that people rely on to find it.
Brand personality and relationships
Brands can also be understood in human terms. Aaker (1997) developed a scale of brand personality with five dimensions: sincerity, excitement, competence, sophistication and ruggedness. The scale has been widely used, but Austin et al. (2003) found that its structure did not generalise well when applied to individual brands within a single category, which suggests caution in using it as a standard measure.
Fournier (1998) studied the relationships that consumers form with brands through in-depth interviews, and described a range of relationship types, from committed partnerships to casual friendships and secret affairs. Fournier argued that brands can play meaningful roles in people's lives and identities. Muniz and O'Guinn (2001) studied brand communities, groups of consumers bound by shared admiration for a brand, and found that they share rituals, traditions and a sense of moral responsibility to each other.
Brands and cultural meaning
Brands also carry meanings drawn from the wider culture. Levy (1959) argued that people buy products not only for what they do but for what they mean, and that symbolic meanings are central to consumption. McCracken (1986) described how cultural meaning moves from the culturally constituted world into products through advertising and fashion, and from products into consumers' lives through rituals of possession, exchange and use.
Holt (2004) studied brands that became cultural icons and argued that they did so by addressing tensions in society, offering myths that resonated with what people were anxious about or aspired to at a particular time. On this view, understanding a brand requires understanding the culture in which it operates, not only the attributes people associate with it.
Qualitative methods are particularly useful for studying brand meaning. Zaltman and Coulter (1995) developed a technique in which participants collect pictures that represent their thoughts and feelings about a topic and then discuss them in depth, eliciting metaphors and associations that structured questions would miss.
Brand perceptions and business results
Do brand perceptions affect financial performance? Mizik and Jacobson (2008) examined data on consumer perceptions of brands and found that some perceptual dimensions, particularly perceptions of a brand's relevance and energy, provided information about future stock returns beyond that contained in accounting measures. Keller and Lehmann (2006) reviewed research on brands and branding and described how brand equity can be assessed at the level of customers, products and financial markets, each with its own methods. Lovett et al. (2014) compiled a large dataset of brands and their characteristics, which illustrates the growing use of systematic data to study how brand perceptions relate to outcomes.
The practical lesson is that brand tracking should be linked, wherever possible, to behaviour and to business results, so that the perceptions measured are those that actually matter.
Brand equity in the market
Perceptions are one way to measure brand strength; market outcomes are another. Ailawadi et al. (2003) proposed the revenue premium, the additional revenue a branded product earns compared with an otherwise similar product without the brand, as an outcome measure of brand equity. They found that it was related to other indicators of brand strength and that it changed in sensible ways in response to brand-related events. Measures of this kind connect brand insight to the price people are willing to pay and the volume they buy, which are often what decision makers care about most.
Brand perceptions also shape what a brand can credibly do next. Aaker and Keller (1990) studied how consumers evaluate extensions of established brands into new categories, and found that extensions were judged more favourably when the original brand was seen as high in quality and when there was a perceived fit between the original category and the new one. Brand insight can therefore inform not only communication but also decisions about which new products and markets a brand can enter.
Methods for brand insight
Brand insight draws on a range of methods:
- Brand tracking surveys measure awareness, consideration, image and preference over time, usually with comparable questions in each wave.
- Association and salience measures ask which brands come to mind for particular needs and occasions.
- Perceptual mapping displays how brands are positioned relative to each other.
- Qualitative research, including in-depth interviews, projective techniques and metaphor elicitation, explores meanings and relationships.
- Text and image analysis of reviews and social media reveals unprompted associations.
- Experiments, such as blind and branded product tests, show how much the brand changes the experience of the product.
Cautions in interpreting brand data
Several cautions apply. Image scores should be interpreted in light of brand size, as discussed above. Prompted associations reflect what people agree with when asked, not necessarily what comes to mind unprompted. Small changes in tracking scores from one wave to the next often reflect sampling variation rather than real change. And brand perceptions should be linked to behaviour, because a brand can be admired without being bought.
Designing a brand tracker
Many organisations measure brand perceptions through a continuous or periodic tracking survey. A few design choices largely determine how useful the tracker will be.
Who is asked. The sample should represent buyers of the category, not only the brand's own customers, because growth usually comes from people who do not yet buy the brand. Results should be reported separately for users and non-users of each brand, to account for the image-usage pattern described above.
What is asked. A tracker should include unprompted and prompted awareness, consideration, recent purchase, a small set of image attributes chosen for their relevance to buying decisions, and measures of salience for key buying occasions. Long lists of attributes add burden without adding much insight, particularly because many attributes move together.
How often and how many. Sample sizes should be large enough that the changes the organisation cares about can be distinguished from sampling variation. A change of two or three percentage points in a small monthly sample is usually noise. Reporting confidence intervals, or rolling averages over several waves, prevents overreaction.
Consistency. Questions, their order and the sampling method should stay the same over time. Changing the questionnaire can create apparent shifts in perceptions that reflect only the change in measurement. When changes are unavoidable, running old and new versions in parallel for a period allows the two series to be linked.
Connection to outcomes. Where possible, tracker results should be analysed alongside sales, market share and advertising activity, so that the organisation learns which perceptions move with business results and which do not.
An example
Consider a hypothetical regional bank that wants to reposition itself as modern and digital. Its tracking survey shows that it scores lower than the two large national banks on "modern" and on most other attributes. Taken at face value, this suggests a serious image problem.
An analyst adjusts for size, comparing each bank's scores with what would be expected given the number of people who bank with it. On this basis, the regional bank scores about as expected on "modern", but well above expectation on "knows my local area" and "treats me as a person". Qualitative interviews confirm that customers value the bank's local knowledge and personal service, and see "digital" as table stakes rather than a reason to choose.
The bank changes its plan. It invests in its app to reach parity with the national banks, treating digital capability as a point of parity, while building its positioning around local knowledge and personal service, its genuine points of difference. It also adds a salience question to its tracker, asking which bank people would think of if they needed advice about a mortgage or a small business loan, because these are the occasions on which new customers are won.
A year later, the tracker shows that the bank's scores on "modern" have risen modestly as more customers use the improved app, while its lead on local knowledge has held. More importantly, the bank is now named more often by people thinking about a mortgage in its region, and applications have risen. The adjustment for brand size prevented an expensive repositioning around an attribute that was never a real weakness, and the qualitative work showed what the bank's customers actually valued.
Key takeaways
Brands exist in people's minds as networks of awareness and associations that influence choice and even the experience of products. Positioning describes how a brand differs from competitors, and perceptual maps can display it, though gaps are hypotheses to be tested. Because brand users associate their brands with most positive attributes, image scores must be interpreted relative to brand size. Salience, the ease with which a brand comes to mind in buying situations, may matter as much as any specific association. Brand personality, relationships and cultural meaning add depth that qualitative methods are well suited to explore. Brand insight is most useful when perceptions are linked to behaviour and business results.
References
Aaker, D. A. (1991). Managing brand equity: Capitalizing on the value of a brand name. Free Press.
Aaker, D. A., & Keller, K. L. (1990). Consumer evaluations of brand extensions. Journal of Marketing, 54(1), 27–41. https://doi.org/10.1177/002224299005400102
Aaker, J. L. (1997). Dimensions of brand personality. Journal of Marketing Research, 34(3), 347–356. https://doi.org/10.1177/002224379703400304
Ailawadi, K. L., Lehmann, D. R., & Neslin, S. A. (2003). Revenue premium as an outcome measure of brand equity. Journal of Marketing, 67(4), 1–17. https://doi.org/10.1509/jmkg.67.4.1.18688
Allison, R. I., & Uhl, K. P. (1964). Influence of beer brand identification on taste perception. Journal of Marketing Research, 1(3), 36–39. https://doi.org/10.1177/002224376400100305
Austin, J. R., Siguaw, J. A., & Mattila, A. S. (2003). A re-examination of the generalizability of the Aaker brand personality measurement framework. Journal of Strategic Marketing, 11(2), 77–92. https://doi.org/10.1080/0965254032000104469
Bird, M., Channon, C., & Ehrenberg, A. S. C. (1970). Brand image and brand usage. Journal of Marketing Research, 7(3), 307–314. https://doi.org/10.1177/002224377000700303
Ehrenberg, A. S. C., Goodhardt, G. J., & Barwise, T. P. (1990). Double jeopardy revisited. Journal of Marketing, 54(3), 82–91. https://doi.org/10.1177/002224299005400307
Fournier, S. (1998). Consumers and their brands: Developing relationship theory in consumer research. Journal of Consumer Research, 24(4), 343–373. https://doi.org/10.1086/209515
Hauser, J. R., & Koppelman, F. S. (1979). Alternative perceptual mapping techniques: Relative accuracy and usefulness. Journal of Marketing Research, 16(4), 495–506. https://doi.org/10.1177/002224377901600407
Holt, D. B. (2004). How brands become icons: The principles of cultural branding. Harvard Business School Press.
Keller, K. L. (1993). Conceptualizing, measuring, and managing customer-based brand equity. Journal of Marketing, 57(1), 1–22. https://doi.org/10.1177/002224299305700101
Keller, K. L., & Lehmann, D. R. (2006). Brands and branding: Research findings and future priorities. Marketing Science, 25(6), 740–759. https://doi.org/10.1287/mksc.1050.0153
Keller, K. L., Sternthal, B., & Tybout, A. (2002). Three questions you need to ask about your brand. Harvard Business Review, 80(9), 80–86.
Levy, S. J. (1959). Symbols for sale. Harvard Business Review, 37(4), 117–124.
Lovett, M., Peres, R., & Shachar, R. (2014). A data set of brands and their characteristics. Marketing Science, 33(4), 609–617. https://doi.org/10.1287/mksc.2014.0861
McClure, S. M., Li, J., Tomlin, D., Cypert, K. S., Montague, L. M., & Montague, P. R. (2004). Neural correlates of behavioral preference for culturally familiar drinks. Neuron, 44(2), 379–387. https://doi.org/10.1016/j.neuron.2004.09.019
McCracken, G. (1986). Culture and consumption: A theoretical account of the structure and movement of the cultural meaning of consumer goods. Journal of Consumer Research, 13(1), 71–84. https://doi.org/10.1086/209048
Mizik, N., & Jacobson, R. (2008). The financial value impact of perceptual brand attributes. Journal of Marketing Research, 45(1), 15–32. https://doi.org/10.1509/jmkr.45.1.15
Muniz, A. M., Jr., & O'Guinn, T. C. (2001). Brand community. Journal of Consumer Research, 27(4), 412–432. https://doi.org/10.1086/319618
Netzer, O., Feldman, R., Goldenberg, J., & Fresko, M. (2012). Mine your own business: Market-structure surveillance through text mining. Marketing Science, 31(3), 521–543. https://doi.org/10.1287/mksc.1120.0713
Park, C. W., Jaworski, B. J., & MacInnis, D. J. (1986). Strategic brand concept-image management. Journal of Marketing, 50(4), 135–145. https://doi.org/10.1177/002224298605000401
Ries, A., & Trout, J. (1981). Positioning: The battle for your mind. McGraw-Hill.
Romaniuk, J. (2018). Building distinctive brand assets. Oxford University Press.
Romaniuk, J., & Sharp, B. (2004). Conceptualizing and measuring brand salience. Marketing Theory, 4(4), 327–342. https://doi.org/10.1177/1470593104047643
Romaniuk, J., Bogomolova, S., & Riley, F. D. (2012). Brand image and brand usage: Is a forty-year-old empirical generalization still useful? Journal of Advertising Research, 52(2), 243–251. https://doi.org/10.2501/JAR-52-2-243-251
Sharp, B. (2010). How brands grow: What marketers don't know. Oxford University Press.
Zaltman, G., & Coulter, R. H. (1995). Seeing the voice of the customer: Metaphor-based advertising research. Journal of Advertising Research, 35(4), 35–51.