
Insights · The insight function
Integrating Multiple Data Sources Into One Insight
Why combining surveys, behavioural data, qualitative research and external sources produces stronger insight than any one source alone, and the methods, from triangulation to record linkage and statistical matching, used to integrate them well.
Few important questions about customers can be answered well from a single source of evidence. A survey can show what customers say they think and do, but not always what they actually do. Transaction data can show what customers buy, but not why. Interviews can reveal motives and meanings, but only for a small number of people. Web analytics, complaint logs, social media, sales reports and market data each add a further partial view. Insight is strongest when these views are brought together so that each fills gaps in the others.
Integration is also one of the hardest tasks in insight work. Sources differ in what they measure, whom they cover, how they define key terms, and how much they can be trusted. Combining them carelessly can produce a confident answer that is wrong. This article explains why integration matters, describes the main methods for combining evidence, from qualitative triangulation to statistical record linkage, and sets out a practical process for producing one coherent insight from many sources.
Why one source is rarely enough
Every source of evidence has characteristic strengths and weaknesses. Webb et al. (1966) made this point in their classic work on unobtrusive measures: every method of data collection has its own sources of error, and because the errors differ across methods, a finding supported by several methods is more credible than one supported by a single method. Campbell and Fiske (1959) gave the idea a formal basis. They argued that a measure is valid only if it agrees with other measures of the same thing obtained by different methods, and differs from measures of different things. Agreement across methods, which they called convergent validity, is evidence that a finding reflects reality rather than the quirks of one method.
The same logic applies to customer insight. Consider the question of why customers leave a subscription service. A cancellation survey will capture the reasons customers choose to give, which may be shaped by what feels acceptable to say. Usage data will show whether customers had stopped using the service before they cancelled, but not why. Customer service records may reveal problems that preceded cancellation. Interviews with former customers can uncover the sequence of events and feelings behind the decision. Each source alone gives a partial and possibly misleading answer; together they can show a pattern that none reveals alone.
The growth of digital data has made integration both more valuable and more complicated. Wedel and Kannan (2016) described how firms now hold data from many touchpoints, in many formats, at many levels of detail, and argued that the main analytic challenge has shifted from collecting data to combining it. Customers increasingly move between channels, researching in one place and buying in another (Verhoef et al., 2015), and their experience is formed across many touchpoints, some controlled by the firm and some not (Lemon & Verhoef, 2016). A view of the customer built from one channel or one touchpoint will miss much of what matters.
Three purposes of integration
It helps to be clear about why sources are being combined, because different purposes call for different methods. Research on mixed methods offers a useful classification. Greene et al. (1989) identified several purposes for combining methods, of which three are especially relevant to insight work.
The first is corroboration: using several sources to test whether they agree, so that a finding can be stated with more confidence. This is triangulation in its original sense.
The second is complementarity: using sources to cover different aspects of the same question. One source shows what happens; another shows why. The aim is not agreement but a more complete picture.
The third is development and expansion: using the results of one source to design or extend another. Interviews may identify issues that a survey then measures at scale, or an unexpected pattern in behavioural data may prompt qualitative research to explain it.
Greene et al. (1989) also noted a fourth purpose, initiation: deliberately looking for contradictions between sources, because contradictions can lead to new questions and new insight. In customer research, the point at which survey responses and behavioural data disagree is often where the most interesting insight lies.
Triangulation
The term triangulation was brought into social research by Denzin (1978), who distinguished four kinds: triangulation of data sources, of investigators, of theories, and of methods. Jick (1979) described how triangulation works in practice in organisational research and made an important observation. Triangulation is useful not only when sources agree but also when they disagree, because disagreement forces the researcher to look for an explanation, which often leads to a richer understanding.
In insight work, triangulation is usually less formal than in academic research, but the principle is the same. Before stating a conclusion, the analyst asks whether the main finding appears in more than one independent source, and if not, how much weight it can bear. A finding that appears in survey data, behavioural data and interviews can be reported with confidence. A finding that appears only in one source should be reported as provisional, with a note on what further evidence would confirm it.
Triangulation requires that the sources be genuinely independent. Two surveys with the same questionnaire and the same panel are not independent sources; they share the same errors. Three teams interpreting the same dataset do not provide data triangulation, although they may provide investigator triangulation. The value of triangulation comes from the differences between the methods.
Integrating qualitative and quantitative evidence
The most common integration task in insight work is combining qualitative and quantitative evidence. Johnson et al. (2007) reviewed definitions of mixed methods research and described it as research that combines elements of qualitative and quantitative approaches for the purposes of breadth and depth of understanding and corroboration. Creswell and Plano Clark (2018) described several basic designs, of which three are widely used in commercial research.
In a convergent design, qualitative and quantitative data are collected at about the same time and analysed separately, and the results are then compared. In an explanatory sequential design, quantitative research comes first and qualitative research follows to explain the results. In an exploratory sequential design, qualitative research comes first, and its results are used to build a survey or other quantitative instrument.
The design matters less than whether integration actually happens. Bryman (2006) examined a large sample of published mixed methods studies and found that many did not genuinely combine their qualitative and quantitative components: the two strands were reported side by side, with little attempt to bring them together. The same failure is common in commercial research, where a report may present survey charts followed by interview quotes without explaining how they relate.
Fetters et al. (2013) described three levels at which integration can occur. At the design level, the study is planned so that the components build on each other. At the methods level, the data are linked, for example by using the same sample for a survey and follow-up interviews, or by using interview findings to build survey items. At the interpretation and reporting level, the results are brought together in a narrative, in tables or displays that place qualitative and quantitative findings side by side, or by transforming one type of data into the other. O'Cathain et al. (2010) described three practical techniques for this: a triangulation protocol, in which findings from each component are listed and compared for agreement, partial agreement, silence or disagreement; following a thread, in which a theme from one component is traced through the others; and a mixed methods matrix, in which qualitative and quantitative data are arranged by case so that patterns across both can be seen.
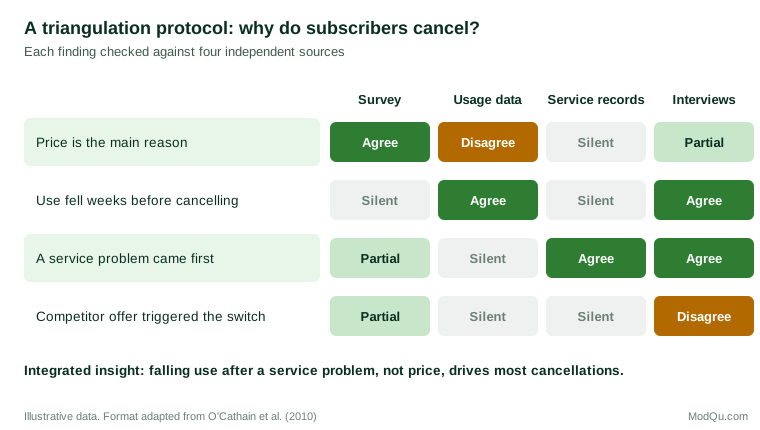
The triangulation protocol is particularly useful for insight teams because it makes the strength of each finding visible. In the example above, the survey suggests that price is the main reason customers cancel. But usage data show that most cancelling customers had stopped using the service several weeks earlier, service records show that many had reported a problem, and interviews suggest that price became a reason to leave only after the service had stopped being useful. The integrated insight is different from the survey finding, and it implies a different response: fixing service problems and re-engaging lapsing users, rather than cutting prices.
Linking records across sources
When sources contain information about the same individuals, such as customers who appear in a CRM system, a transaction database and a survey, integration can happen at the level of the individual record. This allows analysis that no single source supports, such as relating stated attitudes to actual behaviour for the same customers.
Where records share a reliable unique identifier, such as a customer number, linking them is straightforward. Often they do not. Names may be spelled differently, addresses may have changed, and email addresses may differ between systems. Record linkage, also called data matching or entity resolution, is the set of methods for deciding which records refer to the same entity in the absence of a perfect identifier. Fellegi and Sunter (1969) provided the classic statistical framework. For each pair of records, the method compares several fields and calculates how much more likely the observed pattern of agreement and disagreement would be if the records belonged to the same person than if they did not. Pairs above an upper threshold are treated as matches, pairs below a lower threshold as non-matches, and pairs in between are reviewed by hand. Christen (2012) described how modern data matching extends this framework with methods for cleaning and standardising data, reducing the number of comparisons, and using machine learning to classify pairs.
Record linkage introduces its own errors. False matches combine information about different people; missed matches split one person's information across several records. Both can bias analysis. A sound integration process measures linkage quality, for example by reviewing a sample of matched and unmatched pairs, and reports it alongside the results.
Linking records also raises ethical and legal questions. Combining a survey respondent's answers with their transaction history may be permitted only if they consented to it, and may be restricted by data protection law. Integration plans should be reviewed against the organisation's privacy commitments before any linking takes place.
Combining sources without shared individuals
Often the sources to be combined do not contain the same individuals. A survey samples one set of customers; the transaction database contains all customers but no attitudes; an industry panel covers a different population again. In such cases, integration must happen at an aggregate level or through statistical modelling.
Statistical matching, also called data fusion, combines two datasets that share some variables but not individuals. Respondents in one dataset are matched with similar respondents in the other on the shared variables, such as age, region and purchase category, and the variables unique to each dataset are then analysed together as if they came from the same people. Rässler (2002) described the theory and practice of statistical matching and its central limitation: unless strong assumptions hold, fused data cannot reliably show relationships between variables that were never observed together. The method is widely used in media research, where it combines audience and purchasing data, but its results should be treated as estimates resting on assumptions rather than as direct measurements.
Aggregate comparison is simpler and more common. Results from different sources are compared at the level of segments, regions or time periods. For example, survey-based satisfaction scores by region can be compared with complaint rates and churn rates in the same regions. Agreement between the patterns increases confidence; disagreement prompts investigation.
Model-based integration uses statistical models to combine sources formally. A model might use survey data to estimate the relationship between attitudes and behaviour, then apply that relationship to the full customer base using the behavioural data available for everyone. Such approaches require careful attention to missing data, because each source is effectively missing the variables held by the others. Little and Rubin (2019) set out the principles for analysing incomplete data, including the conditions under which missing values can be handled without bias.
Data quality and definitions
Integration exposes problems of quality and definition that are invisible within a single source. Wang and Strong (1996) showed that data consumers judge quality on several dimensions beyond accuracy, including relevance, timeliness, completeness, consistency of representation and accessibility. A source that is accurate but out of date, or complete but defined differently from the others, can still mislead when combined. Batini et al. (2009) reviewed methods for assessing and improving data quality and emphasised that quality must be judged relative to the intended use.
Definitions are a particular source of trouble. Two systems may both report "active customers", but one may count anyone with an account and the other only those who purchased in the last year. Two surveys may both measure satisfaction, but on different scales and with different question wording. Lenzerini (2002) described data integration formally as the problem of providing a unified view over sources with different structures, and showed that the central task is defining how each source's terms relate to the shared view. In practice, this means agreeing common definitions for key measures before integration begins, and documenting how each source maps onto them.
The risks of big data integration
The availability of large behavioural datasets has led some organisations to assume that more data automatically produces better insight. The record suggests caution. Lazer et al. (2014) analysed the case of Google Flu Trends, which estimated influenza levels from search queries. For a period it overestimated flu prevalence substantially, in part because the search data and the relationships the model relied on changed over time. They described the error of treating big data as a substitute for, rather than a supplement to, traditional data collection and analysis, and argued that the best results come from combining large behavioural datasets with smaller, well-designed measurements.
Survey researchers have reached a similar conclusion. Groves (2011) described the field as entering an era in which surveys would increasingly be combined with administrative and digital data, and argued that surveys would remain essential because they can measure attitudes and intentions and can be designed to represent defined populations. Couper (2013) similarly argued that new data sources complement rather than replace surveys. A task force of the American Association for Public Opinion Research reviewed the use of big data in survey research and concluded that such data raise new questions about coverage, measurement and quality that must be addressed before they can be combined reliably with survey results (Japec et al., 2015).
A practical process for integration
Drawing on the methods above, a practical process for producing one insight from many sources has six steps.
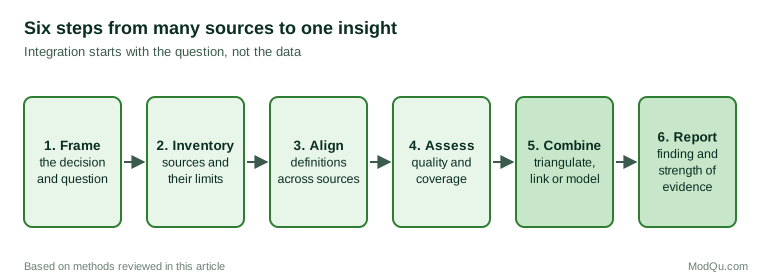
1. Frame the question. Begin with the decision and the question it raises, not with the data available. The question determines which sources are relevant and what kind of integration is needed.
2. Inventory the sources. List the sources that bear on the question, what each measures, whom it covers, when it was collected, and its known limitations. Gaps in the inventory may justify new research.
3. Align definitions. Agree the meaning of key terms and measures across sources, and document how each source maps onto them.
4. Assess quality and coverage. For each source, judge its accuracy, timeliness, completeness and representativeness relative to the question. Weight the sources accordingly.
5. Combine. Choose the method that fits the purpose and the data: a triangulation protocol for comparing findings, record linkage where the same individuals appear in several sources, statistical matching or modelling where they do not, and aggregate comparison where only summaries are available.
6. Interpret and report. State the integrated finding, the sources that support it, the sources that do not, and the strength of the evidence. Where sources disagree, explain the disagreement or say that it remains unexplained.
Organisational requirements
Integration is not only a technical task. It depends on access to data held by different teams, on shared definitions that those teams accept, and on people who understand both the data and the business question. Research on analytics capability shows that data and technology produce value only when combined with skilled people and organisational routines for using them (Gupta & George, 2016). Said et al. (2015) found that managers in large organisations distinguished between information, which was abundant, and insight, which was scarce; integration is one of the main ways the first is turned into the second. Organisations that want integrated insight need to give insight teams access to the relevant sources, establish governance for definitions and data quality, and value analysts who can work across methods rather than within only one.
Common mistakes
Several mistakes recur in integration work. Treating sources as independent when they share the same errors gives false confidence. Combining sources with different definitions produces numbers that look precise but mean little. Reporting qualitative and quantitative findings side by side without integrating them leaves the reader to do the work. Ignoring disagreement between sources discards one of the most useful signals available. Relying on large behavioural datasets alone, without measuring attitudes or checking representativeness, repeats the error Lazer et al. (2014) described. And linking records without measuring linkage quality or checking consent creates both analytic and ethical risk.
Key takeaways
Each source of customer evidence has its own strengths and errors, so insight is stronger when sources are combined. Integration can serve corroboration, complementarity, development or the deliberate search for contradictions. Triangulation tests whether independent sources agree and treats disagreement as a prompt for explanation. Mixed methods designs combine qualitative and quantitative evidence, but integration must actually happen at the design, methods or interpretation stage. Record linkage combines information about the same individuals; statistical matching and modelling combine sources that do not share individuals, at the cost of stronger assumptions. Common definitions, quality assessment and clear reporting of the strength of evidence are essential. The goal is not more data but one well-supported answer to a question that matters.
References
Batini, C., Cappiello, C., Francalanci, C., & Maurino, A. (2009). Methodologies for data quality assessment and improvement. ACM Computing Surveys, 41(3), Article 16. https://doi.org/10.1145/1541880.1541883
Bryman, A. (2006). Integrating quantitative and qualitative research: How is it done? Qualitative Research, 6(1), 97–113. https://doi.org/10.1177/1468794106058877
Campbell, D. T., & Fiske, D. W. (1959). Convergent and discriminant validation by the multitrait-multimethod matrix. Psychological Bulletin, 56(2), 81–105. https://doi.org/10.1037/h0046016
Christen, P. (2012). Data matching: Concepts and techniques for record linkage, entity resolution, and duplicate detection. Springer. https://doi.org/10.1007/978-3-642-31164-2
Couper, M. P. (2013). Is the sky falling? New technology, changing media, and the future of surveys. Survey Research Methods, 7(3), 145–156. https://doi.org/10.18148/srm/2013.v7i3.5751
Creswell, J. W., & Plano Clark, V. L. (2018). Designing and conducting mixed methods research (3rd ed.). SAGE.
Denzin, N. K. (1978). The research act: A theoretical introduction to sociological methods (2nd ed.). McGraw-Hill.
Fellegi, I. P., & Sunter, A. B. (1969). A theory for record linkage. Journal of the American Statistical Association, 64(328), 1183–1210. https://doi.org/10.1080/01621459.1969.10501049
Fetters, M. D., Curry, L. A., & Creswell, J. W. (2013). Achieving integration in mixed methods designs: Principles and practices. Health Services Research, 48(6, Pt. 2), 2134–2156. https://doi.org/10.1111/1475-6773.12117
Greene, J. C., Caracelli, V. J., & Graham, W. F. (1989). Toward a conceptual framework for mixed-method evaluation designs. Educational Evaluation and Policy Analysis, 11(3), 255–274. https://doi.org/10.3102/01623737011003255
Groves, R. M. (2011). Three eras of survey research. Public Opinion Quarterly, 75(5), 861–871. https://doi.org/10.1093/poq/nfr057
Gupta, M., & George, J. F. (2016). Toward the development of a big data analytics capability. Information & Management, 53(8), 1049–1064. https://doi.org/10.1016/j.im.2016.07.004
Japec, L., Kreuter, F., Berg, M., Biemer, P., Decker, P., Lampe, C., Lane, J., O'Neil, C., & Usher, A. (2015). Big data in survey research: AAPOR task force report. Public Opinion Quarterly, 79(4), 839–880. https://doi.org/10.1093/poq/nfv039
Jick, T. D. (1979). Mixing qualitative and quantitative methods: Triangulation in action. Administrative Science Quarterly, 24(4), 602–611. https://doi.org/10.2307/2392366
Johnson, R. B., Onwuegbuzie, A. J., & Turner, L. A. (2007). Toward a definition of mixed methods research. Journal of Mixed Methods Research, 1(2), 112–133. https://doi.org/10.1177/1558689806298224
Lazer, D., Kennedy, R., King, G., & Vespignani, A. (2014). The parable of Google Flu: Traps in big data analysis. Science, 343(6176), 1203–1205. https://doi.org/10.1126/science.1248506
Lemon, K. N., & Verhoef, P. C. (2016). Understanding customer experience throughout the customer journey. Journal of Marketing, 80(6), 69–96. https://doi.org/10.1509/jm.15.0420
Lenzerini, M. (2002). Data integration: A theoretical perspective. In Proceedings of the Twenty-First ACM SIGMOD-SIGACT-SIGART Symposium on Principles of Database Systems (pp. 233–246). ACM. https://doi.org/10.1145/543613.543644
Little, R. J. A., & Rubin, D. B. (2019). Statistical analysis with missing data (3rd ed.). Wiley. https://doi.org/10.1002/9781119482260
O'Cathain, A., Murphy, E., & Nicholl, J. (2010). Three techniques for integrating data in mixed methods studies. BMJ, 341, c4587. https://doi.org/10.1136/bmj.c4587
Rässler, S. (2002). Statistical matching: A frequentist theory, practical applications, and alternative Bayesian approaches. Springer. https://doi.org/10.1007/978-1-4613-0053-3
Said, E., Macdonald, E. K., Wilson, H. N., & Marcos, J. (2015). How organisations generate and use customer insight. Journal of Marketing Management, 31(9–10), 1158–1179. https://doi.org/10.1080/0267257X.2015.1037785
Verhoef, P. C., Kannan, P. K., & Inman, J. J. (2015). From multi-channel retailing to omni-channel retailing: Introduction to the special issue on multi-channel retailing. Journal of Retailing, 91(2), 174–181. https://doi.org/10.1016/j.jretai.2015.02.005
Wang, R. Y., & Strong, D. M. (1996). Beyond accuracy: What data quality means to data consumers. Journal of Management Information Systems, 12(4), 5–33. https://doi.org/10.1080/07421222.1996.11518099
Webb, E. J., Campbell, D. T., Schwartz, R. D., & Sechrest, L. (1966). Unobtrusive measures: Nonreactive research in the social sciences. Rand McNally.
Wedel, M., & Kannan, P. K. (2016). Marketing analytics for data-rich environments. Journal of Marketing, 80(6), 97–121. https://doi.org/10.1509/jm.15.0413