
Insights · The insight function
Democratising Insights Across the Organisation
What it means to democratise insights, why organisations do it, the risks of putting data and research tools in many hands, and a governance model that widens access while protecting the quality of conclusions.
For most of the twentieth century, customer research was produced by specialists and consumed by managers. Research departments and agencies designed studies, analysed the results and presented conclusions. Today, survey platforms, dashboards and analytics tools allow almost anyone in an organisation to run a quick survey, explore customer data or read the latest research directly. Many organisations have embraced this shift under the banner of "democratising insights": making customer understanding available to, and in some cases produced by, people throughout the organisation rather than only a central team.
Democratisation promises faster decisions, broader customer understanding and better use of existing knowledge. It also carries real risks: poorly designed studies, misread statistics and conclusions shaped by what people hoped to find. This article explains what democratisation involves, reviews the evidence on its benefits and risks, and describes a governance model that widens access while protecting the quality of conclusions.
What democratisation means
The term is used for several different things, and it helps to separate them.
Democratised access means that people across the organisation can find and read existing insight: reports, dashboards, summaries and repositories. This is the least contentious form, because the material has already been produced by specialists.
Democratised analysis means that people outside the insight team can explore data themselves, for example by filtering a dashboard, cross-tabulating survey results or querying a customer database. The data have been collected and prepared by specialists, but the conclusions are drawn by others.
Democratised research means that people outside the insight team design and run their own studies, typically quick surveys or small-scale user tests, using self-service tools.
Each step widens the circle of people who shape conclusions about customers, and each step carries more risk. A sound approach to democratisation treats these three forms differently.
Why organisations democratise
The case for democratisation rests on research about how market knowledge creates value. Market orientation research gave as much weight to spreading market intelligence through the organisation as to generating it. Kohli and Jaworski (1990) defined market orientation as the organisation-wide generation of intelligence, its dissemination across departments and the organisation-wide responsiveness to it. Jaworski and Kohli (1993) found that market orientation, including dissemination, was related to business performance. Intelligence that stays inside one department cannot inform decisions made elsewhere.
Democratisation also helps the organisation absorb new knowledge. Cohen and Levinthal (1990) argued that an organisation's ability to recognise and use new external information, which they called absorptive capacity, depends on its prior related knowledge, and that this capacity is built by the people who use knowledge, not only by those who gather it. When product managers, designers and service staff engage directly with customer evidence, they build the understanding that allows them to recognise what new evidence means.
Speed is another reason. A central team can become a bottleneck when demand for insight grows faster than its capacity. When that happens, managers often stop asking, and decisions are made without evidence rather than with it. A visible queue of unanswered requests is a sign that demand for insight exceeds the supply that a central team alone can provide. Simple questions may wait weeks for an answer that a well-designed self-service tool could provide in minutes. Davenport (2006) observed that organisations that compete on analytics tend to make analytical capability widespread, not confined to a few specialists. LaValle et al. (2011) found that organisations with more advanced analytics tended to use insight more widely across functions, rather than restricting it to finance and operations.
Finally, democratisation can increase the use of research. Deshpandé and Zaltman (1982) found that managers were more likely to use market research when they were involved with the research process and when they trusted the researchers. Moorman (1995) found that the ways organisations use market information, as well as how they acquire and transmit it, were linked to new product outcomes. People who have explored the evidence themselves are more likely to believe it and act on it than people who receive a report.
The risks
The same tools that make democratisation possible also make it easy to reach wrong conclusions. Research on statistical reasoning identifies several recurring problems.
Misreading numbers
Many people find statistical information hard to interpret. Peters et al. (2006) found that people with lower numeracy were more influenced by irrelevant aspects of how numbers were presented and drew less precise meaning from them. Gigerenzer et al. (2007) documented widespread misunderstanding of statistics among doctors and patients, including confusion between relative and absolute risk, and showed that much of it could be reduced by presenting information differently. Hoffrage et al. (2000) showed that expressing probabilities as natural frequencies, such as "8 out of 100 customers", rather than percentages or conditional probabilities, greatly improved people's ability to reason correctly. Gal (2002) described statistical literacy as a combination of knowledge, such as an understanding of samples and variation, and critical attitudes, such as a willingness to question claims. Most employees have not been trained in either.
Small samples and noise
People routinely draw strong conclusions from small samples. Tversky and Kahneman (1971) found that even trained researchers expected small samples to resemble the population much more closely than chance allows, a tendency they called the belief in the law of small numbers. A self-service survey of fifty customers, or a dashboard filtered down to a few dozen records, can easily show striking differences that are no more than noise.
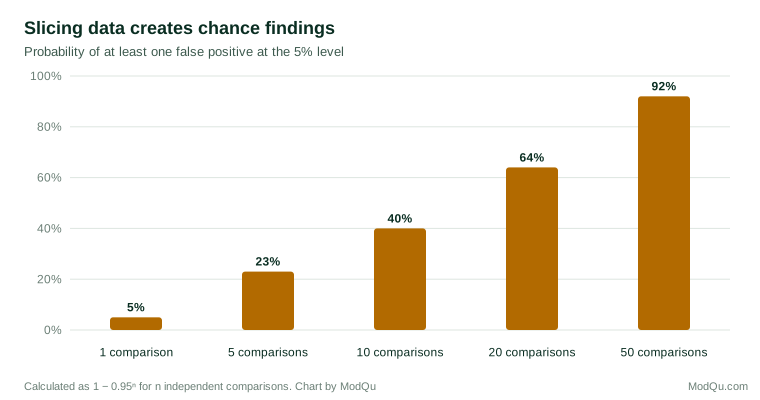
Many comparisons
Self-service tools make it easy to slice data in many ways. Each additional comparison increases the chance of finding a difference that looks meaningful but arose by chance. If an analyst examines twenty independent comparisons, each tested at the conventional 5% significance level, the probability that at least one will appear significant purely by chance is about 64%.
Simmons et al. (2011) showed how flexibility in data analysis, such as choosing which measures to report, which observations to exclude or when to stop collecting data, can make false findings appear statistically significant. Gelman and Loken (2014) argued that the problem arises even without deliberate searching, because analysts make many reasonable choices that depend on the data in front of them, a situation they called the garden of forking paths. Ioannidis (2005) explained why, under conditions of small samples, flexible analyses and many tested relationships, a large share of published findings may be false. Dashboards and self-service analysis tools create exactly these conditions.
Seeing what one wants to see
People who are responsible for a product or campaign have a stake in what the evidence shows. Nickerson (1998) reviewed extensive evidence of confirmation bias: the tendency to seek, interpret and remember information in ways that support existing beliefs. Kahneman (2011) described how fast, intuitive judgement readily constructs a coherent story from the information at hand without asking what information is missing. A product manager who designs a survey about their own product, analyses the results and reports them to their own leadership faces all of these pressures at once.
Poorly designed research
Writing good survey questions, choosing an appropriate sample and interpreting results with the right level of caution are skills that take time to learn. Self-service research run without them can produce leading questions, unrepresentative samples and over-confident conclusions. Because such studies are fast and cheap, they can also multiply, leaving the organisation with many small studies that contradict each other and no clear way to decide which to trust.
A governance model for democratisation
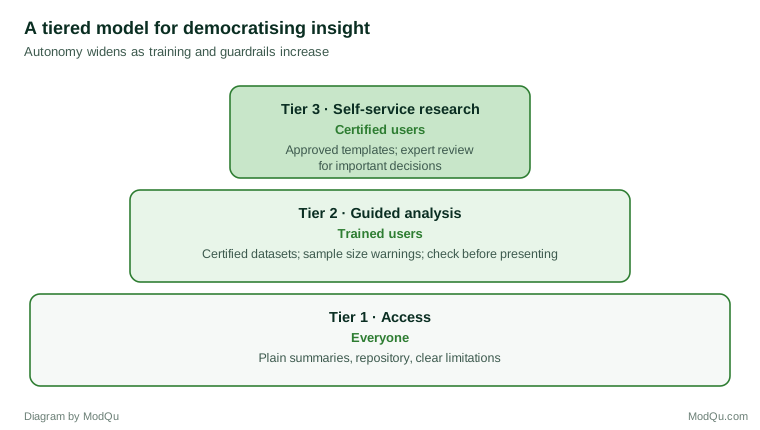
The risks do not mean democratisation should be avoided. They mean it should be designed. A practical model distinguishes levels of autonomy and matches each with appropriate guardrails.
Tier 1: access for everyone
Everyone in the organisation should be able to find and read existing insight. The insight team's job at this level is to make findings understandable to non-specialists: plain-language summaries, clear statements of limitations, and numbers presented in forms that people interpret correctly, such as natural frequencies and absolute rather than relative changes (Gigerenzer et al., 2007; Hoffrage et al., 2000). A well-curated repository, as described elsewhere in this series, is the foundation of this tier.
Tier 2: guided analysis for trained users
People who have completed basic training in reading data can explore prepared datasets and dashboards. The insight team prepares and certifies the data, defining measures consistently and documenting their limits. Tools can include guardrails: warnings when a filtered group falls below a minimum sample size, confidence intervals shown alongside estimates, and clear labels for statistically reliable and unreliable differences. Findings that will inform significant decisions are checked with the insight team before they are presented.
Guided analysis works best when the questions people can ask of the data are matched to what the data can reliably answer. A dashboard built on a large tracking survey may support comparisons between major customer segments but not between small sub-groups. Making these limits visible in the tool, rather than relying on users to remember them, is one of the most effective guardrails available.
Tier 3: self-service research for certified users
People who have completed more advanced training can design and run their own studies using approved templates, such as standard question sets for concept tests, satisfaction measures or usability tests. Templates reduce the risk of leading questions and make results comparable over time. Studies above a defined level of importance, for example those informing major investment or pricing decisions, are reviewed by the insight team before fieldwork and before results are shared. All self-service studies are recorded in the repository so that others can find them.
Enabling practices
Several practices support this model.
Training in data and research literacy. Short, practical training in reading charts, understanding samples and variation, and recognising common errors builds the knowledge and critical attitudes Gal (2002) described. Training is most effective when it uses the organisation's own data and decisions as examples.
Certified data and templates. Prepared datasets with consistent definitions and approved research templates reduce the number of decisions non-specialists must make, and with them the number of forking paths.
Pre-registration for important questions. For studies that will inform major decisions, writing down the question, the measures and the analysis plan before seeing the data reduces the risk of finding patterns that are not there. This practice, recommended by Simmons et al. (2011) for academic research, applies equally to business research. Online experimentation teams use similar disciplines to keep large numbers of tests trustworthy (Kohavi et al., 2020).
Communities of practice. Networks of trained users across the organisation, supported by the insight team, spread good practice and provide a place to ask questions. Hansen (1999) showed that complex knowledge transfers best through strong relationships; communities of practice create such relationships around insight. Cross and Sproull (2004) found that the colleagues people turn to for useful knowledge help them frame problems and check plans, not only answer questions.
A culture that accepts challenge. Democratisation works only if people are willing to have their analyses questioned and to say when the evidence does not support a conclusion. Edmondson (1999) found that teams with greater psychological safety engaged more in learning behaviours such as seeking feedback and discussing errors. Insight teams can model this by reviewing their own work openly.
An illustration
Consider a hypothetical online retailer that gives its product managers access to a self-service survey tool and its customer dashboard. Within months, dozens of small surveys are running. One product manager surveys forty customers about a new delivery option, finds that 70% say they would pay for it, and recommends a launch. Another filters the dashboard to customers in one region who bought in one category in one month, notices that their return rate is twice the average, and proposes a change in policy for that region.
Both conclusions may be wrong. Forty respondents who chose to answer a survey about a delivery option are unlikely to represent all customers, and stated willingness to pay is a poor guide to actual purchasing. The regional return rate rests on a small group selected after many filters were tried, which is the situation in which chance differences most easily appear. Neither manager is careless. Both are doing what the tools invite them to do.
Under the tiered model, the same managers would have worked differently. The delivery question would have been run from a concept test template with a minimum sample size and a standard purchase intention measure, and because it informed a launch decision, it would have been reviewed before fieldwork. The dashboard would have warned that the filtered group was too small for reliable comparison and shown the uncertainty around the return rate. The managers would still have answered their own questions quickly, but with a much lower risk of acting on noise. Their studies would also have been stored in the repository, where others could find and build on them.
The changing role of the insight team
Democratisation changes what the insight team does rather than making it less important. Its role shifts from producing every answer to setting standards, preparing data, building tools and templates, training others, reviewing important work and synthesising what many studies show. Specialists remain essential for complex and high-stakes research, for methods that require expertise, and for integrating evidence across sources.
This shift reflects research on knowledge management. Alavi and Leidner (2001) argued that knowledge management systems are effective when they support the full set of knowledge processes, creation, storage, transfer and application, rather than storage alone. Szulanski (1996) found that knowledge transfer within firms was hindered by recipients' lack of capacity to absorb it. A democratised insight function addresses both: it spreads knowledge widely and builds the capacity of recipients to understand and use it.
Said et al. (2015) found that managers in large organisations valued insight because it was new, shared and acted upon. Democratisation addresses the second and third of these directly. Done well, it means more decisions are informed by evidence; done badly, it means more decisions are informed by noise. The difference lies in the design of access, the quality of guardrails and the investment in people's skills.
A practical checklist
Organisations planning to democratise insights can ask a small set of questions. Can everyone find and understand the insight that already exists? Are the datasets people explore prepared, defined consistently and certified? Do analysis tools warn users about small samples and unreliable differences? Is training required before people analyse data or run studies, and does it cover the common errors described above? Are research templates available for common questions? Is there a clear threshold above which studies must be reviewed by specialists? Are self-service studies recorded so that others can find them? And does the insight team have the time and mandate to set standards and review work, rather than only answer requests?
Key takeaways
Democratising insights can mean wider access to existing findings, self-service analysis of prepared data, or self-service research, and each carries increasing risk. The benefits are supported by research on market orientation, absorptive capacity and research use: insight that is widely shared and engaged with is more likely to inform decisions. The risks are supported by research on statistical reasoning: people misread numbers, over-interpret small samples, find chance patterns when slicing data in many ways, and see what they hope to see. A tiered model that matches autonomy with training and guardrails, supported by certified data, templates, communities of practice and expert review of high-stakes work, captures the benefits while limiting the risks. The insight team's role shifts from producing every answer to enabling good answers throughout the organisation.
References
Alavi, M., & Leidner, D. E. (2001). Review: Knowledge management and knowledge management systems: Conceptual foundations and research issues. MIS Quarterly, 25(1), 107–136. https://doi.org/10.2307/3250961
Cohen, W. M., & Levinthal, D. A. (1990). Absorptive capacity: A new perspective on learning and innovation. Administrative Science Quarterly, 35(1), 128–152. https://doi.org/10.2307/2393553
Cross, R., & Sproull, L. (2004). More than an answer: Information relationships for actionable knowledge. Organization Science, 15(4), 446–462. https://doi.org/10.1287/orsc.1040.0075
Davenport, T. H. (2006). Competing on analytics. Harvard Business Review, 84(1), 98–107.
Deshpandé, R., & Zaltman, G. (1982). Factors affecting the use of market research information: A path analysis. Journal of Marketing Research, 19(1), 14–31. https://doi.org/10.1177/002224378201900102
Edmondson, A. (1999). Psychological safety and learning behavior in work teams. Administrative Science Quarterly, 44(2), 350–383. https://doi.org/10.2307/2666999
Gal, I. (2002). Adults' statistical literacy: Meanings, components, responsibilities. International Statistical Review, 70(1), 1–25. https://doi.org/10.1111/j.1751-5823.2002.tb00336.x
Gelman, A., & Loken, E. (2014). The statistical crisis in science. American Scientist, 102(6), 460–465. https://doi.org/10.1511/2014.111.460
Gigerenzer, G., Gaissmaier, W., Kurz-Milcke, E., Schwartz, L. M., & Woloshin, S. (2007). Helping doctors and patients make sense of health statistics. Psychological Science in the Public Interest, 8(2), 53–96. https://doi.org/10.1111/j.1539-6053.2008.00033.x
Hansen, M. T. (1999). The search-transfer problem: The role of weak ties in sharing knowledge across organization subunits. Administrative Science Quarterly, 44(1), 82–111. https://doi.org/10.2307/2667032
Hoffrage, U., Lindsey, S., Hertwig, R., & Gigerenzer, G. (2000). Communicating statistical information. Science, 290(5500), 2261–2262. https://doi.org/10.1126/science.290.5500.2261
Ioannidis, J. P. A. (2005). Why most published research findings are false. PLoS Medicine, 2(8), e124. https://doi.org/10.1371/journal.pmed.0020124
Jaworski, B. J., & Kohli, A. K. (1993). Market orientation: Antecedents and consequences. Journal of Marketing, 57(3), 53–70. https://doi.org/10.1177/002224299305700304
Kahneman, D. (2011). Thinking, fast and slow. Farrar, Straus and Giroux.
Kohavi, R., Tang, D., & Xu, Y. (2020). Trustworthy online controlled experiments: A practical guide to A/B testing. Cambridge University Press. https://doi.org/10.1017/9781108653985
Kohli, A. K., & Jaworski, B. J. (1990). Market orientation: The construct, research propositions, and managerial implications. Journal of Marketing, 54(2), 1–18. https://doi.org/10.1177/002224299005400201
LaValle, S., Lesser, E., Shockley, R., Hopkins, M. S., & Kruschwitz, N. (2011). Big data, analytics and the path from insights to value. MIT Sloan Management Review, 52(2), 21–31.
Moorman, C. (1995). Organizational market information processes: Cultural antecedents and new product outcomes. Journal of Marketing Research, 32(3), 318–335. https://doi.org/10.1177/002224379503200307
Nickerson, R. S. (1998). Confirmation bias: A ubiquitous phenomenon in many guises. Review of General Psychology, 2(2), 175–220. https://doi.org/10.1037/1089-2680.2.2.175
Peters, E., Västfjäll, D., Slovic, P., Mertz, C. K., Mazzocco, K., & Dickert, S. (2006). Numeracy and decision making. Psychological Science, 17(5), 407–413. https://doi.org/10.1111/j.1467-9280.2006.01720.x
Said, E., Macdonald, E. K., Wilson, H. N., & Marcos, J. (2015). How organisations generate and use customer insight. Journal of Marketing Management, 31(9–10), 1158–1179. https://doi.org/10.1080/0267257X.2015.1037785
Simmons, J. P., Nelson, L. D., & Simonsohn, U. (2011). False-positive psychology: Undisclosed flexibility in data collection and analysis allows presenting anything as significant. Psychological Science, 22(11), 1359–1366. https://doi.org/10.1177/0956797611417632
Szulanski, G. (1996). Exploring internal stickiness: Impediments to the transfer of best practice within the firm. Strategic Management Journal, 17(S2), 27–43. https://doi.org/10.1002/smj.4250171105
Tversky, A., & Kahneman, D. (1971). Belief in the law of small numbers. Psychological Bulletin, 76(2), 105–110. https://doi.org/10.1037/h0031322