
Insights · The insight function
Measuring the Impact of Insights on Business Outcomes
Why the value of insight is hard to measure, the chain from research activity to business outcomes, and practical methods, from decision logs and value-of-information estimates to experiments, for showing what insight contributes.
Insight teams are regularly asked to show their value. Budgets are under pressure, other functions report clear returns, and executives want to know what research and analysis contribute to results. Yet the contribution of insight is genuinely difficult to measure. Insight affects outcomes only through decisions, decisions are shaped by many influences, and the results of a decision may take years to appear. A team that reports only the number of studies completed shows that it has been busy, not that it has made a difference.
This article explains why measuring the impact of insight is difficult, describes a chain that links research activity to business outcomes, and sets out practical methods for showing what insight contributes. It draws on decision theory, research on the use of research, and work on marketing performance measurement.
Why measuring impact is hard
Several features of insight work make its impact hard to measure.
Impact is indirect. Research does not increase sales or reduce costs by itself. It changes, or confirms, decisions that then affect results. Measuring impact therefore means measuring a change in a decision and then the effect of that change.
Many factors shape outcomes. A product launch succeeds or fails because of the product, the price, the competition, the economy and the execution, as well as the research that informed it. Separating the contribution of research from everything else is rarely possible with precision.
The counterfactual is unobserved. The value of insight is the difference between what happened and what would have happened without it. The second is never observed directly.
Some of the most valuable effects are invisible. Research that prevents a bad decision, such as stopping a launch that would have failed, produces no visible result. Weiss (1979) showed that research is often used not to make a specific decision but to change how people think about a problem, which Weiss called conceptual use. Such influence is real but rarely traceable to a single outcome.
Judgements of decisions are biased by outcomes. Baron and Hershey (1988) found that people judge the quality of a decision partly by its outcome, even when the outcome was due to chance. Fischhoff (1975) found that once people know an outcome, they overestimate how predictable it was. Both biases distort judgements about whether research was useful: good research behind a decision that turned out badly is likely to be undervalued, and research that confirmed what turned out to be true may seem to have told people what they already knew.
The impact chain
A useful way to approach measurement is to trace the chain through which insight produces value. Each link in the chain can be measured, and the measures become more meaningful, and harder to obtain, as one moves along it.
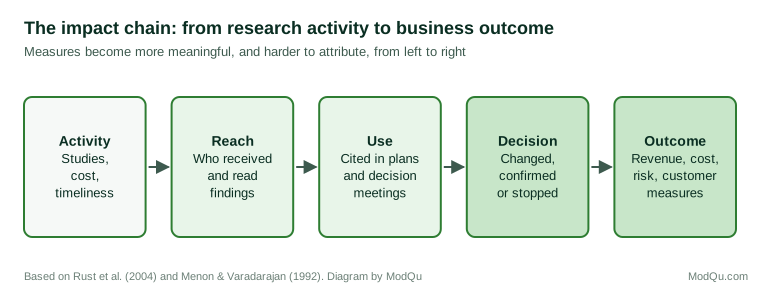
Activity covers what the insight team does: studies completed, their cost, timeliness and quality. These measures are useful for managing the team but say nothing about impact.
Reach covers whether findings get to the people who need them: who received, read or attended a presentation of the findings.
Use covers whether findings are applied: cited in plans, discussed in decision meetings, or reflected in briefs. Menon and Varadarajan (1992) distinguished between instrumental use, in which research directly shapes a decision, and conceptual use, in which it changes understanding. Both can be recorded.
Decision change covers whether a decision was different because of the insight. Decisions can be changed, confirmed with greater confidence, stopped, or redirected.
Outcome covers the business results that followed: revenue, cost, risk avoided, or customer measures such as retention and satisfaction.
Studies of research use in public services describe a similar progression. Nutley et al. (2007) argued that research use is better seen as a continuum than as a single event, running from awareness of the research, through improved knowledge and understanding and changes in attitudes, to changes in practice and decisions. Their review also found that use depends heavily on the interaction between researchers and users: research is more likely to be used when the two work together over time than when findings are simply handed over. For an insight team, this suggests that some of the most useful measures concern the relationship itself, such as how early insight staff are involved in a decision and whether decision makers seek them out.
The chain makes clear why activity measures are insufficient and why outcome measures alone are misleading. A complete picture requires evidence at each stage. Research on the use of market research supports this view. Deshpandé and Zaltman (1982) found that whether managers used research depended on factors such as their trust in the researchers and the presentation of results, which are measurable at the reach and use stages. Moorman (1995) found that the way organisations used market information, not only how they acquired it, was associated with new product outcomes.
Practical methods
No single method measures the impact of insight completely. Several methods together give a credible picture.
Decision logs
The most practical method is to keep a record of the significant decisions that insight informs. For each decision, the log records the question asked, the evidence provided, the options considered, the decision made, whether the evidence changed the decision, and the outcome observed later. Over time, the log provides concrete examples of impact, shows patterns in which kinds of research are most useful, and supports learning from both successes and failures.
A decision log also helps counter outcome and hindsight bias. Because the evidence and reasoning are recorded at the time of the decision, they can later be judged on their merits rather than only by how things turned out. Rousseau (2006) argued that evidence-based management requires learning systematically from the results of decisions, and a decision log is a simple tool for doing so.
Value of information
Decision theory offers a way to estimate the value of research before it is commissioned. Howard (1966) set out the principles of information value theory, and Raiffa and Schlaifer (1961) developed the statistical framework on which it rests. The basic idea is that information is valuable only to the extent that it could change a decision, and that its value depends on how much is at stake and how uncertain the decision maker is.
Consider a simple example. A company is deciding whether to launch a product. If the product succeeds, it will earn a profit of £2 million; if it fails, it will lose £1 million. The company believes the chance of success is 50%. Without further research, the expected value of launching is 0.5 × £2 million minus 0.5 × £1 million, or £0.5 million, which is better than not launching, so the company would launch. If perfect information were available, the company would launch only when the product would succeed, giving an expected value of £1 million. The expected value of perfect information is therefore £0.5 million: no study, however good, could be worth more than this.
Now suppose a study is available that predicts success or failure correctly 80% of the time. If the study is positive, the chance of success rises to 80% and launching has an expected value of £1.4 million. If it is negative, the chance of success falls to 20% and the company should not launch. Since the study is equally likely to be positive or negative, the expected value with the study is £0.7 million. The study is worth £0.2 million, the improvement over deciding without it.
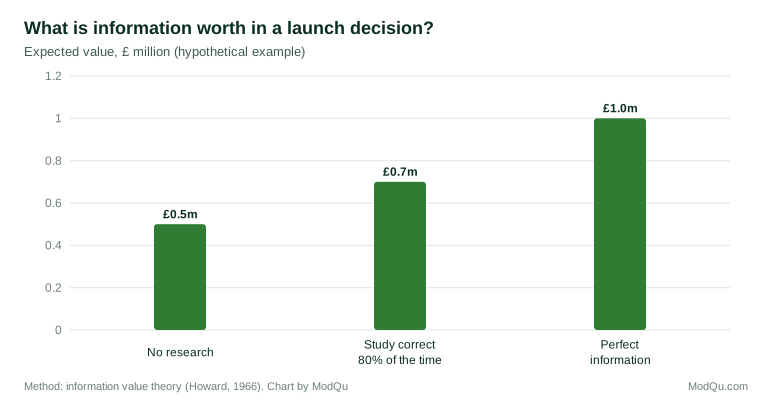
The example is simplified, but the method is useful in practice. Hubbard (2014) argued that many things businesses treat as unmeasurable can be estimated well enough to support decisions, and that value-of-information calculations show where measurement is worth the cost. Even rough estimates help an insight team prioritise studies that could change important decisions and decline those that could not. Recording the estimated value before a study and the actual decision after it provides a disciplined measure of contribution.
Experiments and tests
Where insight leads to a specific change, such as a new message, price, design or offer, the effect of that change can often be measured directly by a controlled experiment. Kohavi et al. (2020) described how organisations run large numbers of online controlled experiments to measure the effect of changes on customer behaviour. When an experiment tests a change that came from customer research, its measured effect provides direct evidence of the research's contribution.
Experiments have limits. Lewis and Rao (2015) showed that measuring the returns to advertising through experiments can require very large samples, because the effect of any single campaign on sales is small relative to the natural variation in customer purchasing. Many decisions informed by insight, such as strategic choices or brand positioning, cannot be tested in a controlled way at all. Experiments are therefore a powerful but partial tool.
Contribution analysis
When attribution is impossible, an alternative is to assess contribution. Mayne (2001) proposed contribution analysis as a way to make credible claims about the contribution of a programme to outcomes when experiments are not possible. The approach sets out the expected chain from activity to outcome, gathers evidence at each link, considers other explanations for the outcome, and builds a reasoned case for how much the activity contributed. Applied to insight, this means documenting how a piece of research reached decision makers, how it was used, how it changed the decision, and what other factors might explain the result.
Stakeholder assessment
Regular structured feedback from the people who use insight, on its relevance, credibility, timeliness and influence on their decisions, provides another source of evidence. Such assessments are subjective and should not be the only measure, but they capture conceptual use and other effects that the other methods miss.
Choosing a set of measures
Research on marketing performance measurement offers lessons for insight teams. Rust et al. (2004) argued that marketing's contribution should be traced through a chain from marketing actions to customer impact, market impact and financial impact, an approach that parallels the impact chain above. Ambler and Roberts (2008) argued that no single metric can capture marketing performance, and that firms should use a set of measures rather than seek one "silver metric". Kaplan and Norton (1992) made a similar argument for business performance in general, proposing a balanced set of measures that covers different perspectives.
A balanced set of measures for an insight function might include one or two activity measures, such as timeliness and cost per study; a reach and use measure, such as the share of major decisions with documented evidence; a decision measure, such as the number of logged decisions that research changed or stopped; outcome evidence from experiments and contribution cases; and a stakeholder assessment.
Avoiding measurement traps
Measures change behaviour, and not always in the intended way. Kerr (1975) described the common problem of rewarding one behaviour while hoping for another. Campbell (1979) observed that the more a quantitative indicator is used for important decisions, the more it is subject to pressures that distort it and the processes it is meant to monitor. An insight team rewarded for the number of studies will produce more studies; one rewarded for positive stakeholder ratings may avoid delivering unwelcome findings. Measures should be chosen to reward influence on decisions, including influence that comes from challenging a plan.
It is also important not to claim too much. Credibility is lost quickly if an insight team attributes the whole success of a product to research that was one input among many. Claims of contribution should be specific, supported by evidence along the chain, and honest about other factors.
A related trap is measuring only what is easy. Activity and reach are simple to count, so they tend to dominate reports. The decision log and contribution cases take more effort, but they are the measures that show whether insight matters.
Evidence from the wider literature
Research on data-driven decision making provides indirect support for the value of insight at the level of the firm. Brynjolfsson et al. (2011) found that firms making greater use of data in decisions had higher productivity than would otherwise be expected. Germann et al. (2013) found that deploying marketing analytics was associated with better firm performance. Said et al. (2015) found that managers valued insight that was new, shared and acted upon. These studies do not measure the impact of a particular insight team, but they show that the use of evidence in decisions is associated with better results, which is the link the impact chain is designed to trace.
Key takeaways
The impact of insight is hard to measure because it is indirect, shaped by many factors, judged against an unobserved counterfactual, and distorted by outcome and hindsight bias. Tracing the chain from activity through reach, use and decision change to outcome shows where evidence can be gathered. Practical methods include decision logs, value-of-information estimates, experiments, contribution analysis and stakeholder assessment. A balanced set of measures that rewards influence on decisions, combined with honest claims of contribution, gives the most credible picture of what insight adds.
References
Ambler, T., & Roberts, J. H. (2008). Assessing marketing performance: Don't settle for a silver metric. Journal of Marketing Management, 24(7–8), 733–750. https://doi.org/10.1362/026725708X345498
Baron, J., & Hershey, J. C. (1988). Outcome bias in decision evaluation. Journal of Personality and Social Psychology, 54(4), 569–579. https://doi.org/10.1037/0022-3514.54.4.569
Brynjolfsson, E., Hitt, L. M., & Kim, H. H. (2011). Strength in numbers: How does data-driven decisionmaking affect firm performance? (SSRN Working Paper). https://doi.org/10.2139/ssrn.1819486
Campbell, D. T. (1979). Assessing the impact of planned social change. Evaluation and Program Planning, 2(1), 67–90. https://doi.org/10.1016/0149-7189(79)90048-X
Deshpandé, R., & Zaltman, G. (1982). Factors affecting the use of market research information: A path analysis. Journal of Marketing Research, 19(1), 14–31. https://doi.org/10.1177/002224378201900102
Fischhoff, B. (1975). Hindsight is not equal to foresight: The effect of outcome knowledge on judgment under uncertainty. Journal of Experimental Psychology: Human Perception and Performance, 1(3), 288–299. https://doi.org/10.1037/0096-1523.1.3.288
Germann, F., Lilien, G. L., & Rangaswamy, A. (2013). Performance implications of deploying marketing analytics. International Journal of Research in Marketing, 30(2), 114–128. https://doi.org/10.1016/j.ijresmar.2012.10.001
Howard, R. A. (1966). Information value theory. IEEE Transactions on Systems Science and Cybernetics, 2(1), 22–26. https://doi.org/10.1109/TSSC.1966.300074
Hubbard, D. W. (2014). How to measure anything: Finding the value of "intangibles" in business (3rd ed.). Wiley.
Kaplan, R. S., & Norton, D. P. (1992). The balanced scorecard: Measures that drive performance. Harvard Business Review, 70(1), 71–79.
Kerr, S. (1975). On the folly of rewarding A, while hoping for B. Academy of Management Journal, 18(4), 769–783. https://doi.org/10.5465/255378
Kohavi, R., Tang, D., & Xu, Y. (2020). Trustworthy online controlled experiments: A practical guide to A/B testing. Cambridge University Press. https://doi.org/10.1017/9781108653985
Lewis, R. A., & Rao, J. M. (2015). The unfavorable economics of measuring the returns to advertising. The Quarterly Journal of Economics, 130(4), 1941–1973. https://doi.org/10.1093/qje/qjv023
Mayne, J. (2001). Addressing attribution through contribution analysis: Using performance measures sensibly. Canadian Journal of Program Evaluation, 16(1), 1–24.
Menon, A., & Varadarajan, P. R. (1992). A model of marketing knowledge use within firms. Journal of Marketing, 56(4), 53–71. https://doi.org/10.1177/002224299205600405
Moorman, C. (1995). Organizational market information processes: Cultural antecedents and new product outcomes. Journal of Marketing Research, 32(3), 318–335. https://doi.org/10.1177/002224379503200307
Nutley, S. M., Walter, I., & Davies, H. T. O. (2007). Using evidence: How research can inform public services. Policy Press.
Raiffa, H., & Schlaifer, R. (1961). Applied statistical decision theory. Division of Research, Graduate School of Business Administration, Harvard University.
Rousseau, D. M. (2006). Is there such a thing as "evidence-based management"? Academy of Management Review, 31(2), 256–269. https://doi.org/10.5465/amr.2006.20208679
Rust, R. T., Ambler, T., Carpenter, G. S., Kumar, V., & Srivastava, R. K. (2004). Measuring marketing productivity: Current knowledge and future directions. Journal of Marketing, 68(4), 76–89. https://doi.org/10.1509/jmkg.68.4.76.42721
Said, E., Macdonald, E. K., Wilson, H. N., & Marcos, J. (2015). How organisations generate and use customer insight. Journal of Marketing Management, 31(9–10), 1158–1179. https://doi.org/10.1080/0267257X.2015.1037785
Weiss, C. H. (1979). The many meanings of research utilization. Public Administration Review, 39(5), 426–431. https://doi.org/10.2307/3109916