
Insights · Generating insight
Finding the Story in the Data
How analysts move from results to a clear, honest narrative that explains what is happening and why it matters, drawing on research on narrative comprehension, persuasion and data visualisation, and the safeguards against telling a story the data do not support.
Insight teams are often told to "find the story in the data". The phrase reflects something true: people understand and remember information better when it is organised as an explanation, with causes, consequences and a point, than when it is presented as a list of results. It also carries a risk. A good story can be more convincing than the evidence warrants. This article explains why stories help, how analysts can find the story that the data actually support, and how to tell it without overstating it.
Why stories help
Psychologists have long argued that people make sense of the world in two complementary ways. Bruner (1986) distinguished a paradigmatic mode of thought, concerned with categories, logic and evidence, from a narrative mode, concerned with intentions, actions and their consequences over time. Business data are usually presented in the first mode; decision makers often reason in the second.
Research on decision making shows how strongly narrative shapes judgement. Pennington and Hastie (1992) studied how jurors evaluate evidence and found that they construct stories to explain it, and that evidence presented in story order, following the sequence of events, was more persuasive than the same evidence presented in the order of witnesses. Green and Brock (2000) found that the more people were absorbed, or "transported", into a narrative, the more their beliefs shifted towards those implied by the story. Dahlstrom (2014) reviewed research on communicating science to non-experts and concluded that narratives are generally easier to understand and more engaging than expository formats, while noting the ethical questions their persuasive power raises.
Weick (1995) described sensemaking in organisations as a process of building plausible accounts of what is going on, and observed that plausibility often matters more to people than accuracy. A clear account of what the data mean helps decision makers act; an unclear one leaves them to construct their own, which may be wrong.
What a data story contains
A story drawn from data is not a fictional narrative. It is an explanation with a clear structure. Most useful data stories contain four elements:
- Context: what was expected or what the situation was, so that the audience understands why the results matter.
- Tension: what the data show that is surprising, problematic or different from expectation.
- Explanation: why this is happening, supported by evidence from the data and other sources.
- Implication: what the organisation should consider doing as a result.
A list of results usually contains only the second element. The other three are what turn results into insight.
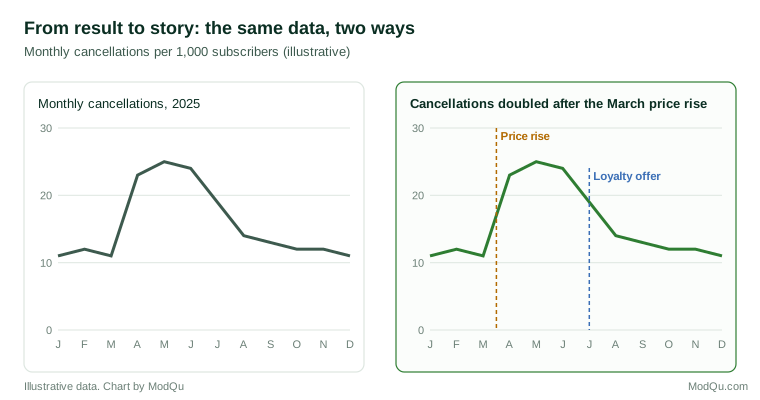
Applied to a simple case, the structure might read as follows. Context: cancellations had been stable at about eleven per thousand subscribers a month. Tension: after the March price rise they doubled and stayed high for three months. Explanation: the increase was concentrated among subscribers on the cheapest plan, and their comments mentioned price far more often than before. Implication: a targeted loyalty offer for this group, introduced in July, was followed by a return towards the earlier level, and similar offers should be considered before future price changes.
Finding the story
The story should come from the data, not be imposed on them. Several practices help.
Start with the decision. The most relevant story is the one that bears on the decision the research was meant to inform. Asking "what does this mean for the choice we face?" filters out results that are interesting but irrelevant.
Look for the gap between expectation and result. The most informative findings are usually those that differ from what people believed. Writing down expectations before analysis makes these gaps visible.
Explore before concluding. Tukey (1977) argued that data should be explored openly, through simple displays, before formal conclusions are drawn. Exploration reveals patterns that a predetermined analysis plan might miss.
Ask why, repeatedly. A finding becomes a story when it is explained. If satisfaction has fallen among new customers, the next questions are which new customers, since when, and what changed. Each answer narrows the explanation.
Test the explanation against other evidence. A plausible explanation should predict other patterns in the data. If the explanation is that a price rise drove customers away, cancellations should cluster after the price rise and among price-sensitive customers. Checking such predictions separates explanations that fit from those that merely sound right.
Consider alternative stories. For any explanation, ask what else could produce the same pattern. A story that survives this challenge is far more trustworthy than one that was never questioned.
The danger of the convincing story
The power of narrative is also its main risk. Kahneman (2011) described how intuitive thinking constructs the most coherent story it can from the information available, without registering what information is missing, and how the confidence people feel in a story depends on its coherence rather than on the quality of the evidence behind it. Nickerson (1998) reviewed extensive evidence of confirmation bias, the tendency to seek and interpret evidence in ways that support existing beliefs. An analyst who has settled on a story will tend to notice the results that support it and overlook those that do not.
Several safeguards help. State the evidence for each part of the story and how strong it is. Report findings that do not fit the story, rather than leaving them out. Distinguish clearly between what the data show and what is inferred. And ask a colleague who was not involved in the analysis to look for weaknesses in the explanation before it is presented.
Telling the story with charts
Charts are central to most data stories, and research on visualisation offers guidance on using them well.
Make the chart say one thing. Segel and Heer (2010) studied narrative visualisation in journalism and other fields and described a range of forms, from annotated charts to slide sequences, that guide the reader through data. A common feature of effective examples was that the author's message was made explicit rather than left for the reader to find.
Use the title to state the finding. Borkin et al. (2016) studied what people recall from visualisations and found that titles and text annotations were among the elements people looked at most and drew on when describing a visualisation from memory, and recommended that titles convey the chart's message. A title such as "Cancellations rose sharply after the March price change" communicates far more than "Monthly cancellations".
Choose charts people read accurately. Cleveland and McGill (1984) found that people judge position along a common scale more accurately than length, angle or area, which is why bar and dot charts are usually preferable to pie charts and bubble charts for comparisons. Shah and Hoeffner (2002) reviewed research on graph comprehension and found that the visual features of a graph, such as which variable is placed on which axis, strongly influence the patterns readers notice.
Remove what does not help. Tufte (2001) argued that the ink in a chart should be devoted mainly to the data, and that decoration and redundant elements distract from the message. Knaflic (2015) offered similar practical guidance for business presentations: remove clutter and use colour and emphasis to direct attention to the point that matters.
Frame honestly. Hullman and Diakopoulos (2011) showed that design choices in narrative visualisations, such as what is emphasised, what is omitted and how axes are scaled, can frame the reader's interpretation in ways that are not always apparent. A chart can tell a true story or a misleading one using the same data; honest framing shows the relevant comparison and the uncertainty.
Making the story memorable
Heath and Heath (2007) argued that ideas that are remembered and acted upon tend to be simple, unexpected, concrete, credible, emotional and told as stories. For data stories, this suggests leading with one clear main message, highlighting what is surprising, using concrete examples such as a typical customer or a specific quotation, showing the evidence that makes the message credible, and connecting the finding to something the audience cares about. These features help a story travel through an organisation after the presentation ends.
Key takeaways
People understand and remember explanations better than lists of results, so presenting data as a story helps insight reach and influence decisions. A data story has four elements: context, tension, explanation and implication. The story should be found in the data through exploration, repeated questioning and testing against other evidence, not imposed on them. Because coherent stories feel more convincing than the evidence may justify, analysts should state the strength of the evidence, report findings that do not fit, and invite challenge. Charts should state the finding in the title, use forms people read accurately, remove clutter and frame the data honestly.
References
Borkin, M. A., Bylinskii, Z., Kim, N. W., Bainbridge, C. M., Yeh, C. S., Borkin, D., Pfister, H., & Oliva, A. (2016). Beyond memorability: Visualization recognition and recall. IEEE Transactions on Visualization and Computer Graphics, 22(1), 519–528. https://doi.org/10.1109/TVCG.2015.2467732
Bruner, J. (1986). Actual minds, possible worlds. Harvard University Press.
Cleveland, W. S., & McGill, R. (1984). Graphical perception: Theory, experimentation, and application to the development of graphical methods. Journal of the American Statistical Association, 79(387), 531–554. https://doi.org/10.1080/01621459.1984.10478080
Dahlstrom, M. F. (2014). Using narratives and storytelling to communicate science with nonexpert audiences. Proceedings of the National Academy of Sciences, 111(Suppl. 4), 13614–13620. https://doi.org/10.1073/pnas.1320645111
Green, M. C., & Brock, T. C. (2000). The role of transportation in the persuasiveness of public narratives. Journal of Personality and Social Psychology, 79(5), 701–721. https://doi.org/10.1037/0022-3514.79.5.701
Heath, C., & Heath, D. (2007). Made to stick: Why some ideas survive and others die. Random House.
Hullman, J., & Diakopoulos, N. (2011). Visualization rhetoric: Framing effects in narrative visualization. IEEE Transactions on Visualization and Computer Graphics, 17(12), 2231–2240. https://doi.org/10.1109/TVCG.2011.255
Kahneman, D. (2011). Thinking, fast and slow. Farrar, Straus and Giroux.
Knaflic, C. N. (2015). Storytelling with data: A data visualization guide for business professionals. Wiley.
Nickerson, R. S. (1998). Confirmation bias: A ubiquitous phenomenon in many guises. Review of General Psychology, 2(2), 175–220. https://doi.org/10.1037/1089-2680.2.2.175
Pennington, N., & Hastie, R. (1992). Explaining the evidence: Tests of the story model for juror decision making. Journal of Personality and Social Psychology, 62(2), 189–206. https://doi.org/10.1037/0022-3514.62.2.189
Segel, E., & Heer, J. (2010). Narrative visualization: Telling stories with data. IEEE Transactions on Visualization and Computer Graphics, 16(6), 1139–1148. https://doi.org/10.1109/TVCG.2010.179
Shah, P., & Hoeffner, J. (2002). Review of graph comprehension research: Implications for instruction. Educational Psychology Review, 14(1), 47–69. https://doi.org/10.1023/A:1013180410169
Tufte, E. R. (2001). The visual display of quantitative information (2nd ed.). Graphics Press.
Tukey, J. W. (1977). Exploratory data analysis. Addison-Wesley.
Weick, K. E. (1995). Sensemaking in organizations. SAGE.