
Insights · Insight quality and pitfalls
Ethical Considerations in the Selective Presentation of Insights
How insights can mislead without any false statement, through selective results, time windows, framing, chart design, omitted uncertainty and spin, why this matters ethically and practically, and the standards and practices that keep presentation honest.
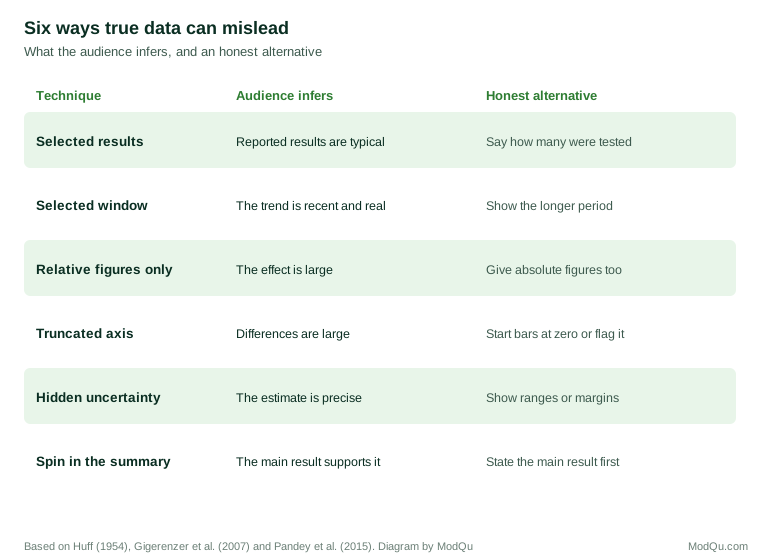
Every presentation of insight involves selection. An analysis may produce dozens of results, but a report can show only a few, and a slide can carry only one message. Choosing what to show, what to leave out and how to frame it is a necessary part of communicating insight. It is also where most of the ethical risk lies. An insight can mislead without containing a single false number: by showing only the results that support a preferred conclusion, by choosing a flattering time period or comparison, by framing a finding to provoke a particular reaction, or by removing the uncertainty that should temper it. This article examines the forms selective presentation takes, why it matters, and the standards and practices that help insight teams stay on the right side of the line.
Misleading without lying
Philosophers and psychologists have long recognised that people can deceive while saying only true things. Grice (1975) observed that listeners assume speakers are being cooperative: that they provide as much information as is needed, no more and no less, and that what they say is relevant. A speaker who says something true but incomplete exploits that assumption, because the listener fills the gap with an inference the speaker knows to be false. Schauer and Zeckhauser (2009) called the deliberate use of truthful statements to create a false impression "paltering". Rogers et al. (2017) studied paltering in negotiations and found that it was common, that people who did it regarded it as more ethical than lying, but that those who were misled, once they discovered it, judged it almost as harshly as a lie and trusted the palterer less.
This matters for insight work because nearly all misleading presentation of data is a form of paltering. The numbers are correct. The impression is not. Bok (1978) argued that deception is wrong because it manipulates the choices of the deceived, depriving them of the information they need to decide for themselves. When decision makers act on an insight presented selectively, they are making choices on the basis of a picture the presenter knew to be distorted.
Forms of selective presentation
Selecting results
The simplest form is to report the results that support a conclusion and omit those that do not. In research more broadly, this occurs through the "file drawer" problem. Rosenthal (1979) warned that if studies with null results remain unpublished in researchers' file drawers, the published literature will overstate the strength of effects. Franco et al. (2014) followed a set of social science studies whose designs had been approved in advance and found that strong results were much more likely to be written up and published than null results, most of which were never even written up. Turner et al. (2008) compared antidepressant trials registered with the United States regulator with the published literature and found that almost all trials with positive results had been published, while most of those with negative or questionable results were either not published or were published in a way that presented them as positive. As a result, the published literature suggested the drugs were considerably more effective than the full set of trials showed.
In organisations the same pattern operates on a smaller scale. A team that tests several campaigns, several segments or several measures of success, and reports only the ones that worked, presents a picture of success that the full set of results does not support.
Selecting the analysis
Results can also be selected indirectly, by choosing the analysis that gives the preferred answer. Simmons et al. (2011) showed that flexibility in choices such as which observations to exclude, which variables to control for and when to stop collecting data can greatly increase the chance of finding a statistically significant effect where none exists. Kerr (1998) described "HARKing", hypothesising after the results are known: presenting a finding discovered by exploring the data as if it had been predicted in advance, which makes a chance result look like the confirmation of a theory.
Selecting the time window or comparison
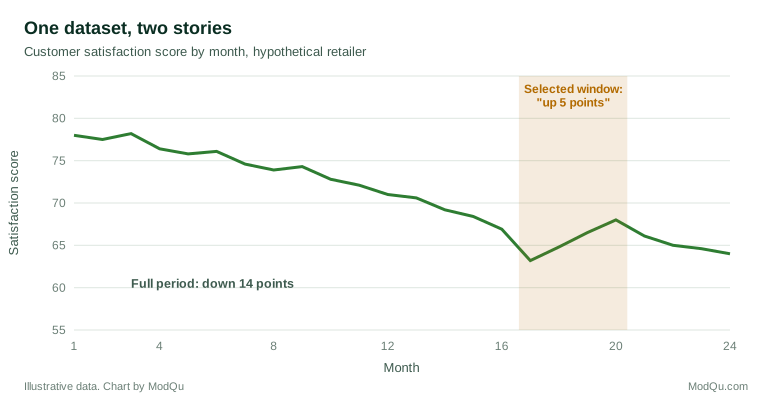
The period over which a trend is shown, and the comparison against which a result is judged, can change its meaning entirely. A metric that has declined over two years may have risen over the last four months; showing only the recent months tells a story of improvement. A result can be compared with last year, with the budget, with the worst competitor or with the average of a group chosen to flatter it.
Framing
Logically equivalent descriptions of the same fact can lead to different judgements. Tversky and Kahneman (1981) showed that people's choices between public health programmes reversed depending on whether the outcomes were described in terms of lives saved or lives lost. Levin and Gaeth (1988) found that consumers rated minced beef more favourably when it was described as 75% lean than when it was described as 25% fat, and that the effect persisted, though weakened, after tasting it.
The way risks and changes are expressed is a common source of framing effects. Gigerenzer et al. (2007) showed that relative risk reductions ("cuts the risk by half") make effects seem much larger than absolute risk reductions ("from 2 in 1,000 to 1 in 1,000"), and that both doctors and patients are influenced by the difference. In business, a conversion rate that rises from 1.0% to 1.5% can be presented as "a 50% increase" or as "an extra half a percentage point". Both are true. The first will usually impress more, and if it is the only figure given, the audience cannot judge the size of the effect for itself.
Chart design
Charts can mislead through choices that are technically correct. Huff (1954) catalogued many of these techniques in a book that remains widely read, including truncated axes, pictures whose area exaggerates differences and selective scales. Tufte (2001) proposed the "lie factor", the ratio of the size of an effect shown in a graphic to the size of the effect in the data, as a measure of graphical distortion. Pandey et al. (2015) tested common distortion techniques experimentally, including truncated vertical axes and area used to represent quantity, and found that they significantly changed how people interpreted the data, often without people realising they had been misled.
Removing uncertainty
Every estimate drawn from data carries uncertainty, but uncertainty is often removed from presentations to make findings seem clearer. A survey estimate is reported without its margin of error; a forecast is shown as a single line; a difference that is within the range of chance is described as a change. van der Bles et al. (2019) reviewed how uncertainty about facts and numbers can be communicated and argued that it should be expressed as precisely as possible. A common concern is that admitting uncertainty damages credibility. In a series of experiments, van der Bles et al. (2020) found that communicating uncertainty as a numerical range slightly reduced trust in the specific numbers, but had little or no effect on trust in the source. Spiegelhalter (2017) argued that communicating risk and uncertainty honestly is part of earning trust rather than a threat to it.
Spin
Spin is the presentation of results in a way that makes them appear more favourable than they are. Boutron et al. (2010) examined reports of randomised controlled trials whose main results were not statistically significant and found that a large proportion used spin, for example by focusing on secondary results that were significant or by interpreting the non-significant main result as showing benefit. Spin also spreads as findings travel. Sumner et al. (2014) found that exaggerations in health news stories, such as causal claims based on correlational studies, were often already present in the press releases issued by the researchers' own universities. In organisations, the equivalent is the summary slide or headline that goes further than the analysis beneath it, which is often all that senior decision makers read.
Selecting quotations and cases
Qualitative findings are open to the same problem. A report on customer interviews can quote the most vivid remarks that support a recommendation and leave out the quieter majority who said something different. A single case study of a delighted customer can be presented in a way that implies it is typical. Because quotations and stories are more memorable than numbers, a selective choice of them can shape decisions even when the accompanying figures tell a more balanced story. The safeguards are similar to those for numbers: say how common a view was, choose quotations that represent their themes fairly, and include the voices of people who disagreed.
Where the line lies
Not every choice about what to show is unethical. A report that leads with its most important finding, uses a clear chart and leaves out minor results is doing its job. The question is whether the selection leaves the audience with an accurate overall picture. A useful test is to imagine a decision maker who later reads the full analysis. If that person would feel that the presentation was a fair summary, the selection was legitimate. If they would feel misled, even though every number was correct, it was not. The test focuses on the impression created, not on the literal accuracy of each statement, which is exactly where selective presentation does its damage.
Why selective presentation happens
Most selective presentation is not the result of a deliberate plan to deceive. It arises from ordinary pressures. Analysts want their work to have impact, and clear, positive findings attract more attention than mixed ones. Teams that ran a campaign or built a product want evidence that it worked. Senior people often ask for simple answers and a single message. Bazerman et al. (2002) argued that auditors who approved misleading accounts were usually not corrupt but were influenced by unconscious bias arising from their relationships with the clients they audited, and that such bias is very difficult to overcome by good intentions alone.
Conflicts of interest are a particular risk. Lexchin et al. (2003) reviewed studies of research funded by pharmaceutical companies and found that such research was more likely to report outcomes favourable to the sponsor than research with other funding. Insight teams face milder versions of this problem when they evaluate initiatives championed by senior colleagues or when an agency evaluates its own campaign. Disclosure helps, but it is not a complete remedy. Cain et al. (2005) found in experiments that advisers who disclosed a conflict of interest sometimes gave more biased advice afterwards, apparently feeling that disclosure had licensed them to do so, while the people receiving the advice did not discount it enough.
Why it matters
Selective presentation has practical as well as ethical costs. Decisions based on a distorted picture are worse decisions: money flows to initiatives that do not work, problems go unaddressed and the organisation learns the wrong lessons. Once discovered, selective presentation also damages the credibility of the insight function. As Rogers et al. (2017) found, people judge being misled by true statements harshly once they realise it has happened. An insight team that is known to tell decision makers what they want to hear loses its main source of value, which is an independent and reliable view of the evidence.
Standards that apply
Professional codes address these issues directly. The ICC/ESOMAR (2016) code requires researchers to ensure that their findings are not presented in a misleading way, and to make clear the limitations of their work. The American Statistical Association's (2022) ethical guidelines call on statisticians to report the methods and assumptions used, to acknowledge the limitations of their analysis, and to avoid presenting results in a way that is selective or misleading. Wasserstein and Lazar (2016), writing for the American Statistical Association, stated that proper inference requires full reporting and transparency, and that conducting many analyses and reporting only those that cross a threshold of statistical significance makes the reported results uninterpretable.
Practices for honest presentation
Several practices help insight teams present selectively, as they must, without misleading:
Decide in advance what will be reported. Before analysis begins, record the main questions, the measures of success and the comparisons that will be made. Nosek et al. (2018) described how preregistration of this kind in science helps distinguish confirmatory tests from exploratory findings. In an organisation, a short analysis plan agreed with the people who commissioned the work serves the same purpose.
Report the denominator. State how many campaigns, segments or measures were examined, not only those that produced notable results.
Separate exploration from confirmation. Findings discovered by exploring the data should be labelled as such and treated as hypotheses to be tested.
Show absolute and relative figures together. When a change is expressed as a percentage, give the starting and ending values as well.
Use honest scales and windows. Start bar charts at zero, mark any break in an axis, and show trends over a period long enough to put recent movements in context.
Include uncertainty. Give ranges, margins of error or confidence intervals for key estimates, and say when a difference could be due to chance.
Make the headline match the evidence. Check that the summary claims no more than the analysis supports. A useful test is to ask whether a sceptical reader of the full analysis would sign the summary.
Present the case against. Where the evidence is mixed, show the main results that point the other way and explain how they were weighed.
Separate evaluation from advocacy. Where possible, have initiatives evaluated by people who were not responsible for them.
Apply the reversal test. Ask whether the result would have been presented in the same way if it had pointed in the opposite direction. If a disappointing result would have received a caveat, a favourable one deserves the same caveat.
A worked example
Consider a hypothetical retailer that redesigned its website and asked its insight team whether the redesign had worked. The team examined eight measures across four customer segments. Two of the 32 results showed significant improvements: conversion among returning mobile customers rose from 2.0% to 2.6%, and average basket size among new desktop customers rose by 4%. Overall conversion was unchanged and the bounce rate rose slightly.
A selective presentation might lead with "Conversion up 30% among mobile customers" and show a chart starting in the month the redesign launched. Every figure in it would be correct. An honest presentation would report that, across the full set of measures, the redesign had little overall effect; that two of 32 results improved, roughly what chance alone might produce; that the mobile result is worth testing again; and that the bounce rate should be watched. The second version is less exciting. It is also the one that allows management to decide sensibly what to do next.
Key takeaways
Selecting and framing findings is unavoidable, but it can mislead without any false statement: by reporting only favourable results, choosing flattering analyses, time windows and comparisons, framing effects to seem larger, designing charts that distort, removing uncertainty, and writing summaries that go beyond the evidence. Such paltering is judged harshly when discovered and leads to worse decisions. It usually arises from ordinary pressures and conflicts of interest rather than deliberate deceit, so good intentions are not enough. Professional codes require that findings are not presented misleadingly. Practical safeguards include deciding in advance what will be reported, stating how many results were examined, showing absolute figures and uncertainty, using honest charts, presenting the case against, and checking that the headline matches the evidence.
References
American Statistical Association. (2022). Ethical guidelines for statistical practice. American Statistical Association.
Bazerman, M. H., Loewenstein, G., & Moore, D. A. (2002). Why good accountants do bad audits. Harvard Business Review, 80(11), 96–102.
Bok, S. (1978). Lying: Moral choice in public and private life. Pantheon Books.
Boutron, I., Dutton, S., Ravaud, P., & Altman, D. G. (2010). Reporting and interpretation of randomized controlled trials with statistically nonsignificant results for primary outcomes. JAMA, 303(20), 2058–2064. https://doi.org/10.1001/jama.2010.651
Cain, D. M., Loewenstein, G., & Moore, D. A. (2005). The dirt on coming clean: Perverse effects of disclosing conflicts of interest. The Journal of Legal Studies, 34(1), 1–25. https://doi.org/10.1086/426699
Franco, A., Malhotra, N., & Simonovits, G. (2014). Publication bias in the social sciences: Unlocking the file drawer. Science, 345(6203), 1502–1505. https://doi.org/10.1126/science.1255484
Gigerenzer, G., Gaissmaier, W., Kurz-Milcke, E., Schwartz, L. M., & Woloshin, S. (2007). Helping doctors and patients make sense of health statistics. Psychological Science in the Public Interest, 8(2), 53–96. https://doi.org/10.1111/j.1539-6053.2008.00033.x
Grice, H. P. (1975). Logic and conversation. In P. Cole & J. L. Morgan (Eds.), Syntax and semantics: Vol. 3. Speech acts (pp. 41–58). Academic Press.
Huff, D. (1954). How to lie with statistics. W. W. Norton.
ICC/ESOMAR. (2016). ICC/ESOMAR international code on market, opinion and social research and data analytics. ESOMAR.
Kerr, N. L. (1998). HARKing: Hypothesizing after the results are known. Personality and Social Psychology Review, 2(3), 196–217. https://doi.org/10.1207/s15327957pspr0203_4
Levin, I. P., & Gaeth, G. J. (1988). How consumers are affected by the framing of attribute information before and after consuming the product. Journal of Consumer Research, 15(3), 374–378. https://doi.org/10.1086/209174
Lexchin, J., Bero, L. A., Djulbegovic, B., & Clark, O. (2003). Pharmaceutical industry sponsorship and research outcome and quality: Systematic review. BMJ, 326(7400), 1167–1170. https://doi.org/10.1136/bmj.326.7400.1167
Nosek, B. A., Ebersole, C. R., DeHaven, A. C., & Mellor, D. T. (2018). The preregistration revolution. Proceedings of the National Academy of Sciences, 115(11), 2600–2606. https://doi.org/10.1073/pnas.1708274114
Pandey, A. V., Rall, K., Satterthwaite, M. L., Nov, O., & Bertini, E. (2015). How deceptive are deceptive visualizations? An empirical analysis of common distortion techniques. In Proceedings of the 33rd Annual ACM Conference on Human Factors in Computing Systems (pp. 1469–1478). ACM. https://doi.org/10.1145/2702123.2702608
Rogers, T., Zeckhauser, R., Gino, F., Norton, M. I., & Schweitzer, M. E. (2017). Artful paltering: The risks and rewards of using truthful statements to mislead others. Journal of Personality and Social Psychology, 112(3), 456–473. https://doi.org/10.1037/pspi0000081
Rosenthal, R. (1979). The file drawer problem and tolerance for null results. Psychological Bulletin, 86(3), 638–641. https://doi.org/10.1037/0033-2909.86.3.638
Schauer, F., & Zeckhauser, R. (2009). Paltering. In B. Harrington (Ed.), Deception: From ancient empires to Internet dating (pp. 38–54). Stanford University Press.
Simmons, J. P., Nelson, L. D., & Simonsohn, U. (2011). False-positive psychology: Undisclosed flexibility in data collection and analysis allows presenting anything as significant. Psychological Science, 22(11), 1359–1366. https://doi.org/10.1177/0956797611417632
Spiegelhalter, D. (2017). Risk and uncertainty communication. Annual Review of Statistics and Its Application, 4, 31–60. https://doi.org/10.1146/annurev-statistics-010814-020148
Sumner, P., Vivian-Griffiths, S., Boivin, J., Williams, A., Venetis, C. A., Davies, A., Ogden, J., Whelan, L., Hughes, B., Dalton, B., Boy, F., & Chambers, C. D. (2014). The association between exaggeration in health related science news and academic press releases: Retrospective observational study. BMJ, 349, Article g7015. https://doi.org/10.1136/bmj.g7015
Tufte, E. R. (2001). The visual display of quantitative information (2nd ed.). Graphics Press.
Turner, E. H., Matthews, A. M., Linardatos, E., Tell, R. A., & Rosenthal, R. (2008). Selective publication of antidepressant trials and its influence on apparent efficacy. New England Journal of Medicine, 358(3), 252–260. https://doi.org/10.1056/NEJMsa065779
Tversky, A., & Kahneman, D. (1981). The framing of decisions and the psychology of choice. Science, 211(4481), 453–458. https://doi.org/10.1126/science.7455683
van der Bles, A. M., van der Linden, S., Freeman, A. L. J., & Spiegelhalter, D. J. (2020). The effects of communicating uncertainty on public trust in facts and numbers. Proceedings of the National Academy of Sciences, 117(14), 7672–7683. https://doi.org/10.1073/pnas.1913678117
van der Bles, A. M., van der Linden, S., Freeman, A. L. J., Mitchell, J., Galvao, A. B., Zaval, L., & Spiegelhalter, D. J. (2019). Communicating uncertainty about facts, numbers and science. Royal Society Open Science, 6(5), Article 181870. https://doi.org/10.1098/rsos.181870
Wasserstein, R. L., & Lazar, N. A. (2016). The ASA statement on p-values: Context, process, and purpose. The American Statistician, 70(2), 129–133. https://doi.org/10.1080/00031305.2016.1154108