
Insights · Insight quality and pitfalls
Insight Quality Assurance Through Multi-Analyst Convergence
When several analysts examine the same data independently, the agreement and disagreement among their conclusions is direct evidence of how robust an insight is. This article explains the research behind multi-analyst checks and how to use them in practice.
Every insight rests on a chain of choices. An analyst decides which respondents to include, how to treat outliers, which variables to control for, how to code open-ended answers and which comparison to emphasise. Each choice is usually defensible. Yet a different analyst, equally competent and equally honest, might make different choices and reach a different conclusion from the same data. Most organisations never find out how much this matters, because each question is analysed by one person or one team.
A growing body of research has tested what happens when many analysts are given the same data and the same question. The results are sobering: conclusions often vary more than the statistical uncertainty in any single analysis would suggest. This article explains that research, sets out why multi-analyst convergence is a useful quality check for business insights, and describes a workflow for applying it without doubling the cost of every project.
The problem: one analysis, many possible analyses
Statisticians have long known that flexible analysis can produce misleading results. Simmons et al. (2011) showed through simulations and experiments that common, seemingly harmless choices, such as when to stop collecting data, which measures to report and which covariates to include, can raise the rate of false positive findings far above the nominal 5%. They called this flexibility "researcher degrees of freedom". Wicherts et al. (2016) later listed 34 such degrees of freedom across the planning, running, analysis and reporting of a study.
Gelman and Loken (2014) made a subtler point. Even without any deliberate search for a significant result, analysts make choices that depend on the data they see. Had the data come out differently, they would have made different choices. They described this as a "garden of forking paths": the analysis actually performed is only one of many that could reasonably have been performed, and its statistical tests do not account for the others.
None of this requires dishonesty. It arises from ordinary professional judgement applied to data that rarely arrive in the exact form a textbook assumes. The question for an insights function is not whether analysts make choices, but how sensitive its conclusions are to those choices.
What many-analyst studies have found
Red cards and skin tone
The best-known demonstration is the study by Silberzahn et al. (2018). Twenty-nine teams, involving 61 analysts, received the same data set on football players and referees and the same question: are referees more likely to give red cards to players with darker skin? The teams chose their own methods. Their estimates, expressed as odds ratios, ranged from 0.89 to 2.93. Twenty teams found a statistically significant positive effect and nine did not. The variation could not be explained by the analysts' expertise or by how the other teams rated the quality of their analysis plans. It came from defensible differences in modelling choices.
Brain imaging
Botvinik-Nezer et al. (2020) gave one functional magnetic resonance imaging data set to 70 independent teams and asked them to test nine predefined hypotheses. No two teams chose an identical analysis workflow, and for several hypotheses the teams split substantially on whether the effect was present. The underlying statistical maps were more similar than the yes-or-no conclusions, which shows that some of the disagreement arose in the final steps of turning results into a verdict.
Immigration and social policy
Breznau et al. (2022) asked 73 research teams to test whether immigration reduces public support for social policies, using the same survey data. Their results ranged from clearly negative to clearly positive effects, with many in between. The authors found that the measured differences between teams' analytic choices explained only part of this spread, and they described the remainder as a "hidden universe of uncertainty" that a single published analysis would never reveal.
What the studies share
These projects come from different fields, but the pattern is consistent. When competent analysts work independently on the same data and question, their conclusions differ more than single-study confidence intervals imply. Figure 1 shows a hypothetical business version of the same pattern.
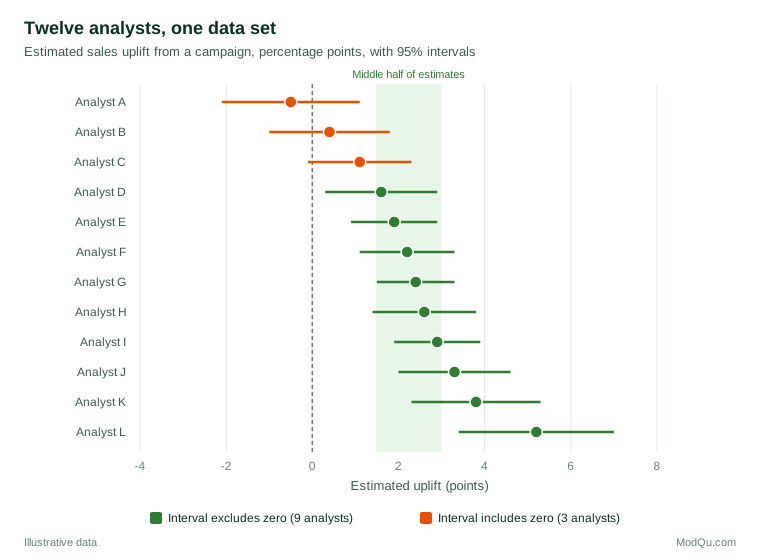
In this illustrative example, nine of twelve analysts would report a significant uplift and three would not. Most estimates cluster between about 1.5 and 3 percentage points. A manager who received only Analyst L's report would expect an uplift above 5 points; one who received only Analyst A's would conclude the campaign did nothing. The cluster in the middle is the better guide, and the spread around it is the honest measure of uncertainty.
Why convergence is evidence
When independent analysts reach the same conclusion by different routes, that agreement is evidence that the conclusion does not depend on any one person's choices. The idea is old. Denzin (1978) described "investigator triangulation", the use of several observers or analysts, as one of four ways to strengthen research conclusions, alongside triangulation of data, theory and method.
There is also a statistical reason. Galton (1907) reported that the median of nearly 800 guesses of an ox's weight at a country fair was within 1% of the true weight. The average of independent judgements cancels out individual errors, provided the errors are not all in the same direction. Larrick and Soll (2006) showed that people underestimate the value of such averaging: they tend to choose the opinion they think is best rather than combine opinions, and they lose accuracy as a result. Clemen (1989), reviewing more than 200 studies of forecasting, concluded that combining forecasts reliably improves accuracy, often by a substantial amount, and that simple averages perform well.
Diversity of approach adds further value. Hong and Page (2004) used a computational model to show that groups of diverse problem solvers can outperform groups of individually higher-ability but similar problem solvers, because diverse approaches explore more of the possible solutions. In analysis, a statistician, a qualitative researcher and a category specialist may each notice a different weakness in the same finding.
Convergence is therefore informative in two ways. Agreement increases confidence. Disagreement locates uncertainty that a single analysis would have hidden, and points to the specific choices that drive it.
Independence is the key condition
Convergence is evidence only if the analysts work independently. If they confer early, their errors become correlated and the benefit of combining them shrinks.
Group discussion has known failure modes. Janis (1982) documented how cohesive groups under pressure suppress dissent and converge on poor decisions, a pattern he called groupthink. Stasser and Titus (1985) found that groups tend to discuss information that all members already share and neglect information held by only one member, even when that unique information is decisive. In analysis teams, this means that a lively meeting at the start of a project can quietly turn several analysts into one.
Methods designed to preserve independence have a long history. The Delphi method, developed at the RAND Corporation, collects expert judgements anonymously and feeds back a summary over several rounds, so that experts can revise their views without the influence of status or persuasion in face-to-face discussion (Dalkey & Helmer, 1963). In geopolitical forecasting tournaments, Mellers et al. (2014) found that training, teaming and careful aggregation of many forecasters' independent probability judgements produced more accurate forecasts than individuals working alone. Structured techniques used in intelligence analysis, such as analysis of competing hypotheses and team "A/B" analysis, also separate independent work from later comparison (Heuer & Pherson, 2015).
The practical rule is simple: analyse independently first, discuss second.
A workflow for multi-analyst quality assurance
Aczel et al. (2021) brought together experienced organisers of many-analyst projects and produced consensus guidance for running and reporting them. Their recommendations, adapted for business insight work, suggest a five-step workflow (Figure 2).
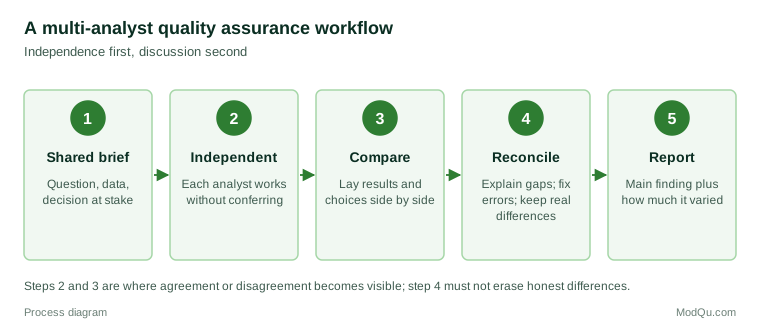
1. Write a shared brief. All analysts receive the same question, the same data and the same description of the decision the insight will inform. The brief should state the question precisely enough that the answers can be compared, for example "estimate the change in repeat purchase rate attributable to the loyalty programme" rather than "look at the loyalty data".
2. Analyse independently. Each analyst or small team works alone and records the main choices made: exclusions, definitions, weights, models and coding rules. Two to four independent analyses are usually enough for routine business questions. Larger numbers are justified only for high-stakes decisions.
3. Compare results and choices. Results are laid side by side in a common format, with the recorded choices. A short table showing each analyst's estimate, interval and key choices often reveals at once which decision drives the differences.
4. Reconcile. The analysts meet to explain differences. Some differences are errors, such as a mis-merged file or a wrong filter, and should be corrected. Others reflect genuinely different reasonable choices, and should be kept and reported. Reconciliation is not a negotiation towards a single number. Schweiger et al. (1986) found that structured debate approaches, such as dialectical inquiry and devil's advocacy, produced higher-quality assumptions and recommendations than simple consensus-seeking, although participants found them less comfortable.
5. Report convergence and spread. The final insight states the main conclusion and how much it varied across analysts, together with the choices that mattered most. "Three of three analyses found a repeat-purchase increase of between 4 and 7 points" is a stronger and more honest statement than "the programme increased repeat purchases by 5.6 points".
Measuring agreement
For quantitative estimates, the spread of results can be summarised with the range, the interquartile range or the standard deviation of the analysts' estimates. A related approach for a single analyst is to run every reasonable combination of analytic choices and display the results. Steegen et al. (2016) called this a multiverse analysis, and Simonsohn et al. (2020) developed specification curve analysis, which plots the estimate from each specification and tests whether the set as a whole supports the claim. These methods simulate many analysts; they cannot reveal choices that no one thought to include, which is why truly independent analysts remain valuable.
For categorical judgements, such as coding open-ended survey answers into themes or classifying customer complaints, agreement between analysts is measured with reliability coefficients. Cohen's kappa adjusts the proportion of agreement between two coders for the agreement expected by chance (Cohen, 1960). Krippendorff's alpha generalises the idea to any number of coders, missing data and different levels of measurement (Hayes & Krippendorff, 2007). Landis and Koch (1977) proposed widely cited labels for kappa values, such as 0.61 to 0.80 for "substantial" agreement, although they presented these as benchmarks for discussion rather than strict rules.
In qualitative research, whether coders should be compared at all is debated. O'Connor and Joffe (2020) review the arguments and conclude that intercoder reliability can improve the rigour and transparency of qualitative analysis when used appropriately, especially for larger projects and coding frames that will be applied by several people. For insight work that combines qualitative coding with counts, such as "34% of complaints concern delivery", measured agreement is strongly advisable, because the count is only as good as the coding behind it.
A worked example
Consider a hypothetical retailer that wants to know whether a new mobile app has increased spending among loyalty members. The insights team gives the same 18-month transaction file and the same brief to three analysts.
- Analyst 1 compares app adopters with non-adopters after adoption and finds that adopters spend 18% more.
- Analyst 2 matches adopters with similar non-adopters on spending before the app was launched and finds a 6% difference.
- Analyst 3 uses each adopter's own spending trend before adoption as the baseline and finds a 4% increase.
The comparison step shows at once that the large estimate comes from comparing groups that already differed: heavy spenders adopted the app first. Analysts 2 and 3 used different methods to deal with this, and their estimates converge at around 4 to 6%. The report to management states that the app is associated with an increase of roughly 4 to 6% in spending among adopters, explains why the naive comparison overstates the effect, and notes that some self-selection may remain. A decision based on 18% would have overstated the return on further app investment threefold.
The same logic applies to qualitative insight. If two analysts independently code 400 customer comments and agree on the main themes but disagree on how to classify comments about "value", the disagreement itself is a finding: the word means different things to different customers, and the next survey should ask about it more precisely.
Reporting convergence to decision-makers
Managers do not need the full detail of every analyst's model, but they do need to know how firm a finding is. A short convergence summary can sit at the top of any report that used more than one analyst:
| Element | Example wording |
|---|---|
| Main conclusion | The app is associated with 4–6% higher spending among adopters. |
| Agreement | Two of three analyses fall in this range; the third used a comparison now judged unsuitable. |
| Main driver of differences | How pre-existing differences between adopters and non-adopters were handled. |
| Remaining uncertainty | Some self-selection may remain; a randomised roll-out would settle it. |
| Decision implication | Supports continued investment; does not support the original 18% business case. |
This format separates what the evidence shows from how sure the team is, which is the distinction decision-makers most often ask analysts to make clearer. It also creates a record. Over time, a library of convergence summaries shows which kinds of question produce stable answers and which do not, and that knowledge helps the team plan future studies.
Building a team culture that welcomes disagreement
The workflow fails if analysts treat a different result as a personal criticism or if managers treat disagreement as a sign of incompetence. Many-analyst research makes the opposite case: variation between careful analysts is normal, and hiding it is the real failure (Silberzahn et al., 2018; Breznau et al., 2022).
Leaders can make this easier in several ways. They can explain at the outset that the aim is to measure robustness, not to find a winner. They can thank analysts who find errors, including their own. They can rotate who analyses first and who reviews, so that no one becomes the permanent authority. They can also make it routine to ask, of any important finding, "would another analyst have reached the same conclusion?" The question costs nothing, and over time it changes how carefully people document their choices.
Costs and how to manage them
Independent replication of every analysis would be expensive. Kahneman et al. (2021) argue that organisations should first measure the variability in their professional judgements, through what they call a noise audit, and then decide where it matters. The same principle applies to insights. Multi-analyst checks are most valuable when:
- the decision is large, costly to reverse or highly visible;
- the data are observational, messy or open to several reasonable treatments;
- the finding is surprising, or exactly what the sponsor hoped for;
- the analysis involves coding or classification by judgement.
For routine tracking reports, lighter checks may be enough: a second analyst reproduces the key figures from the documented steps, or a single analyst runs a small multiverse of the main alternative choices. Periodic multi-analyst exercises on past projects also help a team learn which of its habitual choices make the biggest difference.
Common mistakes
Confusing review with independent analysis. A colleague reading a finished report sees the chosen path through the forking garden and rarely imagines the others. Review catches errors; independent analysis reveals choice-dependence.
Letting the senior analyst set the answer. If the most senior person presents first, others tend to anchor on that result. Collect written results before any discussion.
Averaging away real disagreement. If two analyses disagree because they answer subtly different questions, averaging them produces a number that answers neither. Clarify the question first.
Reporting only the consensus. Management needs to know the spread as well as the centre. A narrow spread justifies confidence; a wide one argues for a staged or reversible decision.
Treating agreement as proof. Analysts who share the same training, the same data and the same blind spots can agree and still be wrong. Convergence shows that a finding survives reasonable choices made with the available data; it cannot correct a biased sample or a badly worded question. Pair it with checks on data quality and with external benchmarks where they exist.
Using the same template for everyone. If every analyst starts from the same script, the analyses are not independent. Share the data and the question, not the code.
Key takeaways
Single analyses hide the influence of analytic choices. Many-analyst studies in psychology, neuroscience and social science have shown that independent experts working on the same data often reach different conclusions. For insights teams, that is both a warning and a tool. Agreement among independent analysts is strong evidence that an insight is robust; disagreement shows where the uncertainty lies and what drives it. The method works only when analysts start independently, record their choices, compare results openly and report the spread as well as the conclusion. Used selectively, for the decisions that matter most, multi-analyst convergence is one of the most direct forms of quality assurance an insights function can adopt.
References
Aczel, B., Szaszi, B., Nilsonne, G., van den Akker, O. R., Albers, C. J., van Assen, M. A. L. M., Bastiaansen, J. A., Benjamin, D., Boehm, U., Botvinik-Nezer, R., Bringmann, L. F., Busch, N. A., Caruyer, E., Cataldo, A. M., Cowan, N., Delios, A., van Dongen, N. N. N., Donkin, C., van Doorn, J. B., … Wagenmakers, E.-J. (2021). Consensus-based guidance for conducting and reporting multi-analyst studies. eLife, 10, Article e72185. https://doi.org/10.7554/eLife.72185
Botvinik-Nezer, R., Holzmeister, F., Camerer, C. F., Dreber, A., Huber, J., Johannesson, M., Kirchler, M., Iwanir, R., Mumford, J. A., Adcock, R. A., Avesani, P., Baczkowski, B. M., Bajracharya, A., Bakst, L., Ball, S., Barilari, M., Bault, N., Beaton, D., Beitner, J., … Schonberg, T. (2020). Variability in the analysis of a single neuroimaging dataset by many teams. Nature, 582(7810), 84–88. https://doi.org/10.1038/s41586-020-2314-9
Breznau, N., Rinke, E. M., Wuttke, A., Nguyen, H. H. V., Adem, M., Adriaans, J., Alvarez-Benjumea, A., Andersen, H. K., Auer, D., Azevedo, F., Bahnsen, O., Balzer, D., Bauer, G., Bauer, P. C., Baumann, M., Baute, S., Benoit, V., Bernauer, J., Berning, C., … Żółtak, T. (2022). Observing many researchers using the same data and hypothesis reveals a hidden universe of uncertainty. Proceedings of the National Academy of Sciences, 119(44), Article e2203150119. https://doi.org/10.1073/pnas.2203150119
Clemen, R. T. (1989). Combining forecasts: A review and annotated bibliography. International Journal of Forecasting, 5(4), 559–583. https://doi.org/10.1016/0169-2070(89)90012-5
Cohen, J. (1960). A coefficient of agreement for nominal scales. Educational and Psychological Measurement, 20(1), 37–46. https://doi.org/10.1177/001316446002000104
Dalkey, N., & Helmer, O. (1963). An experimental application of the Delphi method to the use of experts. Management Science, 9(3), 458–467. https://doi.org/10.1287/mnsc.9.3.458
Denzin, N. K. (1978). The research act: A theoretical introduction to sociological methods (2nd ed.). McGraw-Hill.
Galton, F. (1907). Vox populi. Nature, 75(1949), 450–451. https://doi.org/10.1038/075450a0
Gelman, A., & Loken, E. (2014). The statistical crisis in science. American Scientist, 102(6), 460–465. https://doi.org/10.1511/2014.111.460
Hayes, A. F., & Krippendorff, K. (2007). Answering the call for a standard reliability measure for coding data. Communication Methods and Measures, 1(1), 77–89. https://doi.org/10.1080/19312450709336664
Heuer, R. J., Jr., & Pherson, R. H. (2015). Structured analytic techniques for intelligence analysis (2nd ed.). CQ Press.
Hong, L., & Page, S. E. (2004). Groups of diverse problem solvers can outperform groups of high-ability problem solvers. Proceedings of the National Academy of Sciences, 101(46), 16385–16389. https://doi.org/10.1073/pnas.0403723101
Janis, I. L. (1982). Groupthink: Psychological studies of policy decisions and fiascoes (2nd ed.). Houghton Mifflin.
Kahneman, D., Sibony, O., & Sunstein, C. R. (2021). Noise: A flaw in human judgment. Little, Brown Spark.
Landis, J. R., & Koch, G. G. (1977). The measurement of observer agreement for categorical data. Biometrics, 33(1), 159–174. https://doi.org/10.2307/2529310
Larrick, R. P., & Soll, J. B. (2006). Intuitions about combining opinions: Misappreciation of the averaging principle. Management Science, 52(1), 111–127. https://doi.org/10.1287/mnsc.1050.0459
Mellers, B., Ungar, L., Baron, J., Ramos, J., Gürçay, B., Fincher, K., Scott, S. E., Moore, D., Atanasov, P., Swift, S. A., Murray, T., Stone, E., & Tetlock, P. E. (2014). Psychological strategies for winning a geopolitical forecasting tournament. Psychological Science, 25(5), 1106–1115. https://doi.org/10.1177/0956797614524255
O'Connor, C., & Joffe, H. (2020). Intercoder reliability in qualitative research: Debates and practical guidelines. International Journal of Qualitative Methods, 19. https://doi.org/10.1177/1609406919899220
Schweiger, D. M., Sandberg, W. R., & Ragan, J. W. (1986). Group approaches for improving strategic decision making: A comparative analysis of dialectical inquiry, devil's advocacy, and consensus. Academy of Management Journal, 29(1), 51–71. https://doi.org/10.5465/255859
Silberzahn, R., Uhlmann, E. L., Martin, D. P., Anselmi, P., Aust, F., Awtrey, E., Bahník, Š., Bai, F., Bannard, C., Bonnier, E., Carlsson, R., Cheung, F., Christensen, G., Clay, R., Craig, M. A., Dalla Rosa, A., Dam, L., Evans, M. H., Flores Cervantes, I., … Nosek, B. A. (2018). Many analysts, one data set: Making transparent how variations in analytic choices affect results. Advances in Methods and Practices in Psychological Science, 1(3), 337–356. https://doi.org/10.1177/2515245917747646
Simmons, J. P., Nelson, L. D., & Simonsohn, U. (2011). False-positive psychology: Undisclosed flexibility in data collection and analysis allows presenting anything as significant. Psychological Science, 22(11), 1359–1366. https://doi.org/10.1177/0956797611417632
Simonsohn, U., Simmons, J. P., & Nelson, L. D. (2020). Specification curve analysis. Nature Human Behaviour, 4(11), 1208–1214. https://doi.org/10.1038/s41562-020-0912-z
Stasser, G., & Titus, W. (1985). Pooling of unshared information in group decision making: Biased information sampling during discussion. Journal of Personality and Social Psychology, 48(6), 1467–1478. https://doi.org/10.1037/0022-3514.48.6.1467
Steegen, S., Tuerlinckx, F., Gelman, A., & Vanpaemel, W. (2016). Increasing transparency through a multiverse analysis. Perspectives on Psychological Science, 11(5), 702–712. https://doi.org/10.1177/1745691616658637
Wicherts, J. M., Veldkamp, C. L. S., Augusteijn, H. E. M., Bakker, M., van Aert, R. C. M., & van Assen, M. A. L. M. (2016). Degrees of freedom in planning, running, analyzing, and reporting psychological studies: A checklist to avoid p-hacking. Frontiers in Psychology, 7, Article 1832. https://doi.org/10.3389/fpsyg.2016.01832