
Insights · Insight quality and pitfalls
Bias Audits for Insight Generation Pipelines
How to audit the chain that turns data into insight for systematic bias, stage by stage from data collection to the use of findings, with the questions to ask, the tests to run and how to document the results.
Insights are produced by a chain of steps: deciding what to measure, collecting data, cleaning and combining it, analysing it, interpreting the results and acting on them. Bias can enter at any step. A survey that misses a group of customers, a measure that works better for some groups than others, a model trained on past decisions or an analyst's expectations can each tilt the result in a consistent direction. A bias audit is a structured review of this chain, designed to find such distortions before they shape decisions. This article describes how to carry one out.
Where bias enters
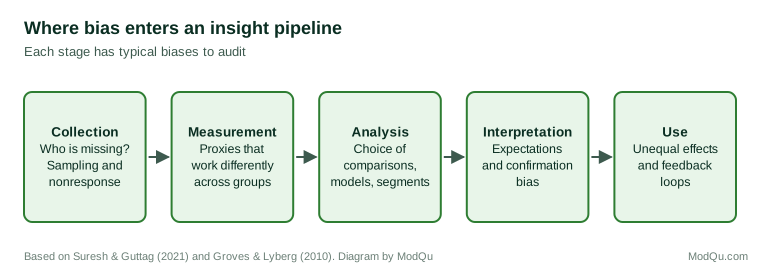
Suresh and Guttag (2021) set out a framework of the sources of harm in the life cycle of a machine learning system, distinguishing bias that arises from the world as it is (historical bias), from who is included in the data (representation bias), from how concepts are measured (measurement bias), from how results are aggregated and evaluated, and from how a system is deployed. Survey researchers have a similar framework. Groves and Lyberg (2010) described "total survey error", which traces errors to coverage, sampling, nonresponse, measurement and processing. Both frameworks make the same point: bias is not one problem but several, at different stages. Barocas and Selbst (2016) added that bias need not be intended: data mining can produce discriminatory results simply because the data reflect past discrimination, because the target being predicted is defined in a way that disadvantages some groups, or because neutral-seeming variables act as proxies for protected characteristics.
Auditing each stage
Data collection. Compare the people in the data with the population the insight is meant to describe. Who is missing, under-represented or over-represented? Customers who do not use digital channels, who do not respond to surveys or who left before the data were collected are common gaps. Gebru et al. (2021) proposed that every dataset be accompanied by a "datasheet" recording how it was collected, who is included, and what it should and should not be used for.
Measurement. Check whether the measures mean the same thing for different groups. Obermeyer et al. (2019) found that an algorithm used to allocate extra health care underestimated the needs of Black patients because it used past health spending as a measure of need, and less had been spent on Black patients who were equally ill. The proxy was biased, not the arithmetic. Buolamwini and Gebru (2018) found that commercial systems for classifying gender from faces made far more errors for darker-skinned women than for lighter-skinned men, because of the images on which they had been developed.
Analysis. Review the choices of comparison, segment, model and metric. Results that hold on average may hide very different results for subgroups, so break key findings down by the groups that matter. Mitchell et al. (2019) proposed "model cards" that report a model's performance separately for relevant groups and state its intended uses.
Interpretation. Ask whether the conclusion would have been accepted as readily if it had pointed the other way. Findings that confirm what the organisation already believed deserve the same scrutiny as surprising ones.
Use. Consider how acting on the insight will affect different groups, and whether it will change the data collected in future. Lambrecht and Tucker (2019) found that an advertisement for jobs in science and technology, intended to be shown without regard to gender, was shown to fewer women than men, because women were a more expensive audience to reach and the delivery algorithm minimised cost. No one intended the bias; it arose from the way the system was used. Acting on insights can also create feedback loops, for example when customers who are offered less receive less and then appear in the data as less valuable.
Tests that help
Several practical tests support an audit:
- Coverage comparison. Compare the composition of the data with an external benchmark such as census or customer records.
- Subgroup breakdown. Report key results and error rates separately for relevant groups.
- Proxy check. Ask whether a measure stands in for something else, and whether that relationship differs across groups.
- Counterfactual test. Change only a group attribute, such as region or gender, in otherwise identical records, and see whether the output changes. This follows the logic of audit studies, which Sandvig et al. (2014) proposed adapting to examine online platforms and algorithms, and of classic field experiments such as that of Bertrand and Mullainathan (2004), who sent otherwise identical job applications with different names and found that those with names associated with white applicants received more callbacks.
- Outcome review. After an insight is acted on, check whether results differed across groups.
Fairness involves choices
Audits often reveal that no single analysis can satisfy every definition of fairness. Kleinberg et al. (2017) showed mathematically that, except in special cases, a risk score cannot be equally well calibrated for different groups and also have equal rates of false positives and false negatives across them. An audit cannot remove the need for judgement, but it can make the trade-offs explicit, so that decision makers choose knowingly rather than by default.
An example
Consider a hypothetical bank whose insight team concludes, from app usage data, that customers over 65 are "low engagement" and should receive fewer offers. An audit of the pipeline finds problems at three stages. At collection, the data cover only app activity, while many older customers bank by telephone and in branches, so their engagement is undercounted. At measurement, "engagement" is defined as app log-ins, a proxy that works much better for younger customers. At use, sending fewer offers to older customers would reduce their product take-up, which would later appear in the data as further evidence of low engagement. Once branch and telephone contacts are added, the engagement gap between age groups largely disappears, and the recommendation is withdrawn.
Organising the audit
Raji et al. (2020) proposed a framework for internal audits of algorithmic systems that runs alongside development, with defined stages for scoping, mapping, gathering artefacts, testing and reflection, and documentation at each stage. For an insight team, a lighter version works well: a short checklist for each stage of the pipeline, completed for important projects, reviewed by someone outside the project team, and kept with the findings. The record shows what was checked, what was found and what was done about it.
Key takeaways
Bias can enter insight work at every stage, from who is included in the data to how findings are used. A bias audit reviews each stage in turn, using tests such as coverage comparisons, subgroup breakdowns, proxy checks and counterfactual tests. Some trade-offs between fairness criteria cannot be avoided, but an audit makes them visible. Documenting the audit alongside the findings makes the insight more trustworthy and easier to review.
References
Barocas, S., & Selbst, A. D. (2016). Big data's disparate impact. California Law Review, 104(3), 671–732. https://doi.org/10.15779/Z38BG31
Bertrand, M., & Mullainathan, S. (2004). Are Emily and Greg more employable than Lakisha and Jamal? A field experiment on labor market discrimination. American Economic Review, 94(4), 991–1013. https://doi.org/10.1257/0002828042002561
Buolamwini, J., & Gebru, T. (2018). Gender shades: Intersectional accuracy disparities in commercial gender classification. Proceedings of Machine Learning Research, 81, 77–91.
Gebru, T., Morgenstern, J., Vecchione, B., Vaughan, J. W., Wallach, H., Daumé III, H., & Crawford, K. (2021). Datasheets for datasets. Communications of the ACM, 64(12), 86–92. https://doi.org/10.1145/3458723
Groves, R. M., & Lyberg, L. (2010). Total survey error: Past, present, and future. Public Opinion Quarterly, 74(5), 849–879. https://doi.org/10.1093/poq/nfq065
Kleinberg, J., Mullainathan, S., & Raghavan, M. (2017). Inherent trade-offs in the fair determination of risk scores. In Proceedings of the 8th Innovations in Theoretical Computer Science Conference (Article 43). Schloss Dagstuhl. https://doi.org/10.4230/LIPIcs.ITCS.2017.43
Lambrecht, A., & Tucker, C. (2019). Algorithmic bias? An empirical study of apparent gender-based discrimination in the display of STEM career ads. Management Science, 65(7), 2966–2981. https://doi.org/10.1287/mnsc.2018.3093
Mitchell, M., Wu, S., Zaldivar, A., Barnes, P., Vasserman, L., Hutchinson, B., Spitzer, E., Raji, I. D., & Gebru, T. (2019). Model cards for model reporting. In Proceedings of the Conference on Fairness, Accountability, and Transparency (pp. 220–229). ACM. https://doi.org/10.1145/3287560.3287596
Obermeyer, Z., Powers, B., Vogeli, C., & Mullainathan, S. (2019). Dissecting racial bias in an algorithm used to manage the health of populations. Science, 366(6464), 447–453. https://doi.org/10.1126/science.aax2342
Raji, I. D., Smart, A., White, R. N., Mitchell, M., Gebru, T., Hutchinson, B., Smith-Loud, J., Theron, D., & Barnes, P. (2020). Closing the AI accountability gap: Defining an end-to-end framework for internal algorithmic auditing. In Proceedings of the 2020 Conference on Fairness, Accountability, and Transparency (pp. 33–44). ACM. https://doi.org/10.1145/3351095.3372873
Sandvig, C., Hamilton, K., Karahalios, K., & Langbort, C. (2014, May 22). Auditing algorithms: Research methods for detecting discrimination on internet platforms [Paper presentation]. Data and Discrimination: Converting Critical Concerns into Productive Inquiry, preconference of the 64th Annual Meeting of the International Communication Association, Seattle, WA, United States.
Suresh, H., & Guttag, J. (2021). A framework for understanding sources of harm throughout the machine learning life cycle. In Equity and Access in Algorithms, Mechanisms, and Optimization (Article 17). ACM. https://doi.org/10.1145/3465416.3483305