
Insights · What an insight is
Data, Findings and Insights: Why the Difference Matters
Data, findings and insights are often used as if they meant the same thing. This article separates the three, shows how one becomes the next, and explains why confusing them leads to weak research and poor decisions.
Research reports often use the words data, findings and insights interchangeably. A slide headed "Key insights" may contain nothing but percentages, while a "findings" section may hold the most important interpretation in the report. The confusion is more than a matter of vocabulary. Each term describes a different kind of output, produced by a different kind of work, and each supports a different kind of decision. Research teams that blur them tend to deliver too much of the first two and too little of the third.
Three levels of output
Information scientists have long distinguished between data, information and knowledge. In the widely cited hierarchy described by Ackoff (1989) and reviewed by Rowley (2007), data are raw symbols, information is data organised to answer questions such as who, what and how many, and knowledge is information applied to answer how and why. Zins (2007) collected definitions from dozens of information scientists and found little agreement on the exact boundaries, but the general idea of increasing levels of meaning was widely shared. Critics such as Frické (2009) warn that the hierarchy makes the climb look more mechanical than it is, since interpretation always involves judgement. In applied research the same idea can be expressed in three practical levels.
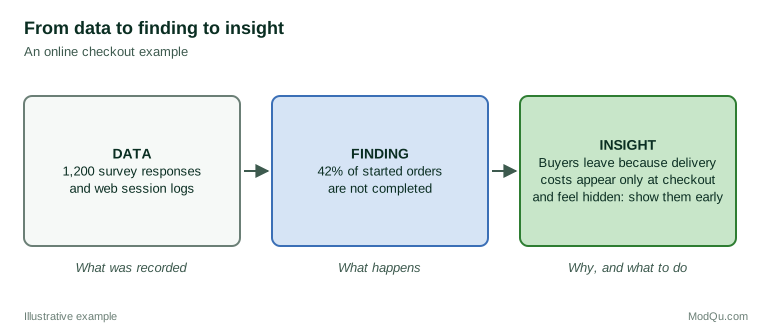
Data are the recorded responses and measurements themselves: the answers in a survey file, the timestamps in a web log, the transcripts of interviews. Data have no meaning until someone organises and interprets them.
Findings are statements about what the data show. "Forty-two percent of customers who started an online order did not complete it" is a finding. So is "Customers under 35 rate the service lower than older customers". Findings describe patterns, differences and relationships. They answer what and how much.
Insights explain why a pattern exists, in a way that changes how decision-makers understand the situation and suggests what they should do. "Customers abandon their orders because delivery charges appear only at the final step, which they read as a hidden cost" is an insight, provided the evidence supports it. It explains the finding, it is new to the organisation, and it points to an action.
Why the distinction matters
Findings do not explain themselves
A finding can be accurate and still mislead. The fact that younger customers give lower satisfaction ratings could mean that they receive worse service, that they have higher expectations, that they use the rating scale differently, or that they are mostly new customers who have not yet learned how the service works. Each explanation implies a different action. Presenting the finding alone leaves decision-makers to supply their own explanation, and they will usually choose the one that matches what they already believe. Nisbett and Wilson (1977) showed that people readily produce confident explanations for behaviour, including their own, without access to the real causes. Interpretation that is left unstated does not disappear; it simply happens without evidence.
Volume is not value
Modern research tools make it easy to produce hundreds of findings. Every cross-tabulation produces several, and dashboards can update them continuously. But decision-makers have limited attention. Studies of how companies use market research have found that research is used more when it is clear, relevant to the decisions at hand and delivered in a way that fits how managers think (Deshpandé & Zaltman, 1982). A report with 80 findings and no interpretation asks the reader to do the analyst's job. A report with three well-supported insights does that work for them. Weiss (1979) observed that research is often used not to make one specific decision but to change, gradually, how people think about a problem, a process Weiss called enlightenment. Insights are the outputs most likely to have that effect, because they alter understanding rather than adding one more number to an already long list.
Insight is what organisations say they want
Said, Macdonald, Wilson and Marcos (2015) studied how large organisations generate and use customer insight. Managers distinguished clearly between information, which their companies had in abundance, and insight, which was scarce. Insight was valued because it was new, shared and acted upon. The market orientation research of the 1990s made a similar point: what matters is not just generating market intelligence but spreading it and responding to it (Kohli & Jaworski, 1990). Moorman (1995) found that the way organisations process market information, including how they use it in decisions, was linked to new product outcomes. Delivering findings when insights are needed leaves the most valuable step undone.
How findings become insights
Turning findings into insights is not a single technique, but several habits help.
- Ask why after every finding. For each important pattern, list the possible explanations and look for evidence that separates them. Open-ended responses, follow-up interviews and comparisons between subgroups often provide that evidence.
- Connect findings to each other. Insights usually emerge from combining several findings. Lower ratings among younger customers, a higher share of first-time buyers in that group and frequent complaints about confusing instructions together suggest a learning problem rather than a service problem.
- Look for contradictions. Klein and Jarosz (2011) found that noticing something that does not fit is a common trigger of insight among professionals. A finding that contradicts what the organisation expects deserves particular attention.
- Test the explanation. An insight is a claim about causes. Where possible, check it with further analysis, a small experiment or a comparison with other data before presenting it as established.
- State the implication. Write down what decision would change if the insight is true. If no decision would change, the result may be interesting but it is not an insight in the business sense.
Common mistakes
Labelling findings as insights. Calling a percentage an insight does not make it one. Overuse of the word teaches readers to ignore it.
Skipping the evidence. The opposite mistake is presenting a confident explanation that the data cannot support. An insight without evidence is an opinion. Weick (1995) described sensemaking as the process by which people turn ambiguous situations into plausible stories; plausibility is useful, but it is not proof.
Confusing statistical and practical significance. A difference can be statistically significant and too small to matter, or large and important but uncertain because the sample is small. The American Statistical Association has warned that a p-value alone does not measure the size or importance of an effect (Wasserstein & Lazar, 2016). Findings should be judged by their size and relevance as well as their statistical tests.
Forgetting the data. Insights depend on the quality of the data beneath them. Exploratory analysis of the raw data, including checks for errors, outliers and odd distributions, should come before interpretation (Tukey, 1977).
A simple test
When reviewing a research output, three questions show which level it belongs to:
- Does it describe what was recorded? Then it is data.
- Does it describe a pattern in what was recorded? Then it is a finding.
- Does it explain why the pattern exists, in a way that is new and suggests a decision? Then it may be an insight, if the evidence supports it.
Each level is necessary. Insights without sound data and accurate findings are speculation. Data and findings without insight are a missed opportunity. Davenport and Prusak (1998) described knowledge as information combined with experience, context and interpretation; that combination is exactly what turns a finding into an insight.
Key takeaways
Data are recorded observations. Findings describe patterns in those observations. Insights explain why the patterns exist and what to do about them. The distinction matters because findings left uninterpreted invite unsupported explanations, because decision-makers have limited attention, and because insight is the output organisations value most. Good research moves deliberately from one level to the next, tests its explanations, and labels each output for what it is.
References
Ackoff, R. L. (1989). From data to wisdom. Journal of Applied Systems Analysis, 16, 3–9.
Davenport, T. H., & Prusak, L. (1998). Working knowledge: How organizations manage what they know. Harvard Business School Press.
Deshpandé, R., & Zaltman, G. (1982). Factors affecting the use of market research information: A path analysis. Journal of Marketing Research, 19(1), 14–31. https://doi.org/10.1177/002224378201900102
Frické, M. (2009). The knowledge pyramid: A critique of the DIKW hierarchy. Journal of Information Science, 35(2), 131–142. https://doi.org/10.1177/0165551508094050
Klein, G., & Jarosz, A. (2011). A naturalistic study of insight. Journal of Cognitive Engineering and Decision Making, 5(4), 335–351. https://doi.org/10.1177/1555343411427013
Kohli, A. K., & Jaworski, B. J. (1990). Market orientation: The construct, research propositions, and managerial implications. Journal of Marketing, 54(2), 1–18. https://doi.org/10.1177/002224299005400201
Moorman, C. (1995). Organizational market information processes: Cultural antecedents and new product outcomes. Journal of Marketing Research, 32(3), 318–335. https://doi.org/10.1177/002224379503200307
Nisbett, R. E., & Wilson, T. D. (1977). Telling more than we can know: Verbal reports on mental processes. Psychological Review, 84(3), 231–259. https://doi.org/10.1037/0033-295X.84.3.231
Rowley, J. (2007). The wisdom hierarchy: Representations of the DIKW hierarchy. Journal of Information Science, 33(2), 163–180. https://doi.org/10.1177/0165551506070706
Said, E., Macdonald, E. K., Wilson, H. N., & Marcos, J. (2015). How organisations generate and use customer insight. Journal of Marketing Management, 31(9–10), 1158–1179. https://doi.org/10.1080/0267257X.2015.1037785
Tukey, J. W. (1977). Exploratory data analysis. Addison-Wesley.
Wasserstein, R. L., & Lazar, N. A. (2016). The ASA statement on p-values: Context, process, and purpose. The American Statistician, 70(2), 129–133. https://doi.org/10.1080/00031305.2016.1154108
Weick, K. E. (1995). Sensemaking in organizations. Sage.
Weiss, C. H. (1979). The many meanings of research utilization. Public Administration Review, 39(5), 426–431. https://doi.org/10.2307/3109916
Zins, C. (2007). Conceptual approaches for defining data, information, and knowledge. Journal of the American Society for Information Science and Technology, 58(4), 479–493. https://doi.org/10.1002/asi.20508