
Insights · Customer and market insight
Churn Insight: Why Customers Leave
How to understand why customers leave, covering the different types of churn, what research shows about the causes of switching, how to combine prediction with explanation, and why retention efforts should focus on customers whose decision can be changed.
Every organisation loses customers. Some losses are unavoidable: people move, their needs change, or their circumstances no longer fit. Others result from problems the organisation could have prevented. Churn insight is the work of understanding which is which, why customers leave, and what can be done about it. It combines prediction, identifying who is likely to leave, with explanation, understanding why, and both are needed to act well.
Types of churn
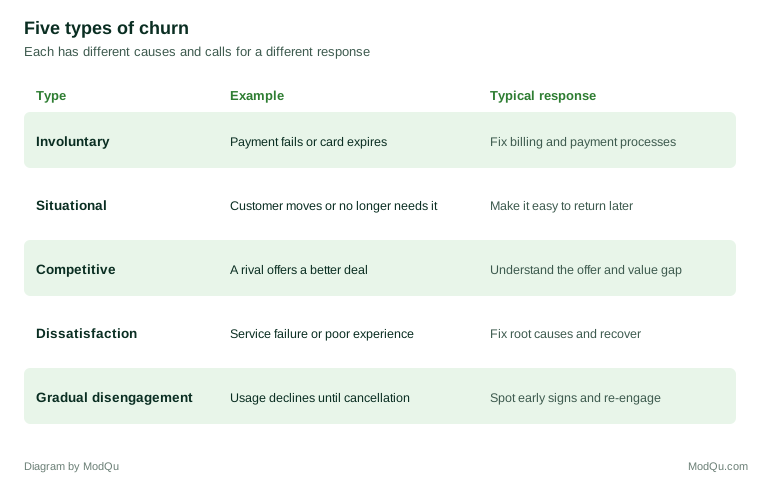
Customers leave in different ways and for different reasons, and treating churn as a single phenomenon hides important differences.
Hirschman (1970) described exit as one of two responses open to dissatisfied customers, the other being voice. Customers who exit without voicing their dissatisfaction give the organisation little information about what went wrong, which is why understanding churn often requires deliberate research.
Why customers switch
Keaveney (1995) used the critical incident technique, developed by Flanagan (1954), to ask over 500 customers of service businesses to describe what had led them to switch providers. Keaveney grouped the reasons into categories including core service failures, failures in service encounters with staff, pricing, inconvenience, poor responses to service failures, attraction by competitors, ethical problems and involuntary switching. Core service failures and service encounter failures were among the most frequently mentioned. Many switching decisions involved more than one cause, often a sequence of problems rather than a single event.
Bansal et al. (2005) developed a framework describing switching as a migration driven by "push" factors that drive customers away from their current provider, such as dissatisfaction and low trust, "pull" factors that attract them to alternatives, and "mooring" factors, such as switching costs and inertia, that keep them in place even when they are dissatisfied. Burnham et al. (2003) identified several types of switching costs, including procedural costs of time and effort, financial costs, and relational costs of breaking personal bonds. Jones et al. (2000) found that switching barriers, such as strong relationships with staff and the perceived attractiveness of alternatives, weakened the link between satisfaction and repurchase intentions: customers with high barriers stayed even when they were less satisfied.
These findings explain a common puzzle. Some dissatisfied customers stay, held by switching costs, while some apparently satisfied customers leave, pulled by a better offer or pushed by a change in circumstances. Satisfaction is part of the story, but not all of it.
Satisfaction does matter over time. Bolton (1998) studied customers of a mobile phone service and found that customers' cumulative satisfaction predicted how long they stayed, and that recent experiences of poor service had a disproportionate effect on the decision to leave.
When customers leave
Churn is rarely spread evenly across a customer's relationship. In many businesses it is highest in the first months, when customers are deciding whether the product meets their expectations, and declines among those who stay.
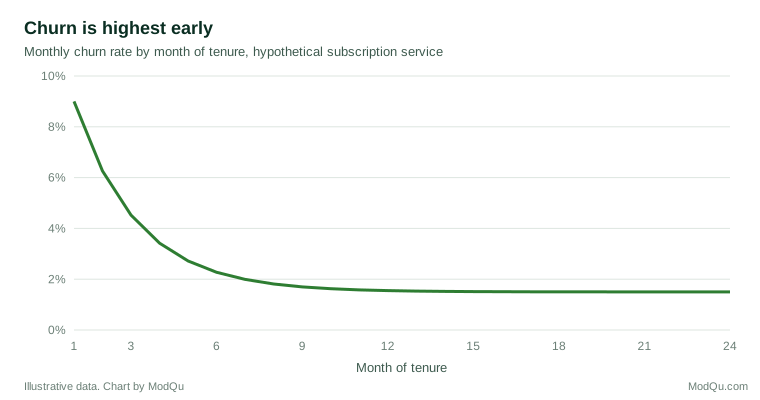
Fader and Hardie (2007) explained that falling churn rates over tenure partly reflect differences between customers rather than changes in each customer: those most likely to leave do so early, leaving a more loyal group behind. Distinguishing the two explanations matters for forecasting and for deciding where to intervene.
Some churn is delayed by inertia. DellaVigna and Malmendier (2006) found that many gym members on monthly contracts paid more than they would have on a pay-per-visit basis and took longer to cancel after they stopped attending than the cost justified. Customers who have stopped using a product but have not yet cancelled are, in effect, churned customers who have not yet left.
Usage is often the earliest warning. Gourville and Soman (2002) argued that whether customers consume what they have paid for strongly affects whether they buy again, and that the way payments are timed can affect consumption: customers who pay in a single lump sum tend to use the product less as the payment fades from memory, which makes them less likely to renew. For subscription businesses, declining usage is therefore both a symptom of disengagement and a cause of later churn, and tracking it gives the organisation time to respond.
Why retention matters
The economic case for understanding churn is strong. Reichheld and Sasser (1990) argued that reducing customer defections could have a large effect on profits, because retained customers tend to buy more, cost less to serve and refer others over time. Even where the precise numbers vary by industry, the principle that keeping existing customers is often cheaper than replacing them is widely accepted, and it is one reason churn receives so much attention.
But retention is not equally valuable for every customer. Mittal and Kamakura (2001) found that customers with similar levels of satisfaction could differ greatly in their likelihood of buying again, depending on characteristics such as age, education and gender. The implication is that the same experience can lead to different behaviour in different groups, and that churn analysis should look at how the drivers of leaving vary between customer segments rather than assuming one pattern for all.
Predicting churn
Organisations with customer data often build models to predict who will leave. Neslin et al. (2006) reported a tournament in which many teams built churn models on the same data, and found that the methods used had a substantial effect on predictive accuracy and on the profit that could be expected from acting on the predictions. Lemmens and Croux (2006) found that machine learning methods combining many classification trees predicted churn more accurately than simpler methods. Burez and Van den Poel (2009) addressed a common practical problem: because churners are usually a small minority, models must be designed to avoid simply predicting that everyone stays.
From prediction to explanation and action
Prediction alone is not enough. Ascarza (2018) analysed retention campaigns and found that the customers with the highest predicted risk of leaving were not necessarily those most responsive to retention efforts, and that targeting customers by their likely response produced better results. Ascarza et al. (2018) reviewed research on retention management and argued that firms should focus on the incremental effect of their actions, which requires experiments or other methods that compare treated and untreated customers.
Explanation guides action. Exit surveys, interviews with recent leavers and analysis of complaints and usage before cancellation show why customers leave, and so which causes the organisation can address. A model may show that customers who contact support three times in a month are at high risk; interviews may show that they are calling about a recurring billing error. The right response is to fix the error, not to offer a discount.
Researching churn well
Several practices help. Interview recent leavers soon after they leave, while the experience is fresh. Ask them to describe the sequence of events that led to the decision, not only the final reason, because switching often follows several problems. Compare leavers with similar customers who stayed, to separate causes of leaving from characteristics common to all customers. Link stated reasons to behavioural data, such as usage, contacts and payments before leaving. And distinguish between the types of churn, because the responses differ.
An example
Consider a hypothetical online learning platform with monthly subscriptions. Its churn model identifies customers at risk, and it sends them discounts, but churn remains stubbornly high. The insight team interviews forty recent leavers and analyses usage before cancellation.
Three patterns emerge. A large group signed up for a specific course, finished it and left; for them, leaving was a natural end, and the best response is to make returning easy and to suggest a next course at the right moment. A second group stopped using the platform within the first month, often after struggling to find suitable courses; for them, better onboarding and recommendations are the answer. A third, smaller group left after repeated payment failures they did not notice, an involuntary loss that a simple change to payment reminders could prevent.
The platform redesigns its approach around these three types. It tests each change against a comparison group and finds that the onboarding changes and payment reminders reduce churn substantially, while discounts for the at-risk group had done little. The model still has a role, but now as a way of directing the right intervention to the right customers.
Key takeaways
Churn has several types, from involuntary and situational losses to competitive switching, dissatisfaction and gradual disengagement. Research shows that switching is often triggered by service failures, shaped by push, pull and mooring factors, and moderated by switching costs. Churn is usually highest early in a relationship. Predictive models identify who is likely to leave, but explanation is needed to understand why, and retention efforts should target customers whose decision can be changed, with their effects tested against a comparison group.
References
Ascarza, E. (2018). Retention futility: Targeting high-risk customers might be ineffective. Journal of Marketing Research, 55(1), 80–98. https://doi.org/10.1509/jmr.16.0163
Ascarza, E., Neslin, S. A., Netzer, O., Anderson, Z., Fader, P. S., Gupta, S., Hardie, B. G. S., Lemmens, A., Libai, B., Neal, D., Provost, F., & Schrift, R. (2018). In pursuit of enhanced customer retention management: Review, key issues, and future directions. Customer Needs and Solutions, 5(1–2), 65–81. https://doi.org/10.1007/s40547-017-0080-0
Bansal, H. S., Taylor, S. F., & James, Y. S. (2005). "Migrating" to new service providers: Toward a unifying framework of consumers' switching behaviors. Journal of the Academy of Marketing Science, 33(1), 96–115. https://doi.org/10.1177/0092070304267928
Bolton, R. N. (1998). A dynamic model of the duration of the customer's relationship with a continuous service provider: The role of satisfaction. Marketing Science, 17(1), 45–65. https://doi.org/10.1287/mksc.17.1.45
Burez, J., & Van den Poel, D. (2009). Handling class imbalance in customer churn prediction. Expert Systems with Applications, 36(3), 4626–4636. https://doi.org/10.1016/j.eswa.2008.05.027
Burnham, T. A., Frels, J. K., & Mahajan, V. (2003). Consumer switching costs: A typology, antecedents, and consequences. Journal of the Academy of Marketing Science, 31(2), 109–126. https://doi.org/10.1177/0092070302250897
DellaVigna, S., & Malmendier, U. (2006). Paying not to go to the gym. American Economic Review, 96(3), 694–719. https://doi.org/10.1257/aer.96.3.694
Fader, P. S., & Hardie, B. G. S. (2007). How to project customer retention. Journal of Interactive Marketing, 21(1), 76–90. https://doi.org/10.1002/dir.20074
Flanagan, J. C. (1954). The critical incident technique. Psychological Bulletin, 51(4), 327–358. https://doi.org/10.1037/h0061470
Gourville, J. T., & Soman, D. (2002). Pricing and the psychology of consumption. Harvard Business Review, 80(9), 90–96.
Hirschman, A. O. (1970). Exit, voice, and loyalty: Responses to decline in firms, organizations, and states. Harvard University Press.
Jones, M. A., Mothersbaugh, D. L., & Beatty, S. E. (2000). Switching barriers and repurchase intentions in services. Journal of Retailing, 76(2), 259–274. https://doi.org/10.1016/S0022-4359(00)00024-5
Keaveney, S. M. (1995). Customer switching behavior in service industries: An exploratory study. Journal of Marketing, 59(2), 71–82. https://doi.org/10.1177/002224299505900206
Lemmens, A., & Croux, C. (2006). Bagging and boosting classification trees to predict churn. Journal of Marketing Research, 43(2), 276–286. https://doi.org/10.1509/jmkr.43.2.276
Mittal, V., & Kamakura, W. A. (2001). Satisfaction, repurchase intent, and repurchase behavior: Investigating the moderating effect of customer characteristics. Journal of Marketing Research, 38(1), 131–142. https://doi.org/10.1509/jmkr.38.1.131.18832
Neslin, S. A., Gupta, S., Kamakura, W., Lu, J., & Mason, C. H. (2006). Defection detection: Measuring and understanding the predictive accuracy of customer churn models. Journal of Marketing Research, 43(2), 204–211. https://doi.org/10.1509/jmkr.43.2.204
Reichheld, F. F., & Sasser, W. E., Jr. (1990). Zero defections: Quality comes to services. Harvard Business Review, 68(5), 105–111.