
The Generation of Knowledge · Trust, quality and the future
Communication and Dissemination Strategies for Knowledge Generated Through the Seven Disciplines
How to communicate and disseminate knowledge produced through inquiry, research, surveys, statistics, investigation, intelligence and insights, covering the questions every dissemination plan must answer, layered reporting, presenting numbers and uncertainty, effective charts and the conditions under which decision-makers actually use evidence.
Knowledge that is not communicated changes nothing. A carefully designed survey, a rigorous analysis or a well-tested insight has value only when it reaches the people who can use it, in a form they can understand and at a time when it can still affect their decisions. Communication is therefore not a final step added after the real work is done, but part of the generation of knowledge itself. This article sets out the main principles for communicating and disseminating knowledge produced through the seven disciplines of inquiry, research, surveys, statistics, investigation, intelligence and insights.
Five questions for every plan
Lavis et al. (2003), studying how Canadian research organisations transfer knowledge to decision-makers, proposed that every dissemination plan answer five questions. What should be communicated: the main message, not every finding. To whom: the specific audiences who can act on it. By whom: the messenger, whose credibility with the audience matters as much as the message. How: the channels and formats that suit each audience. And with what effect: how the organisation will know whether communication worked. Graham et al. (2006) placed dissemination within a wider cycle of knowledge translation, in which knowledge is adapted to local contexts, barriers to its use are assessed and its use is monitored and sustained.
Layered reporting
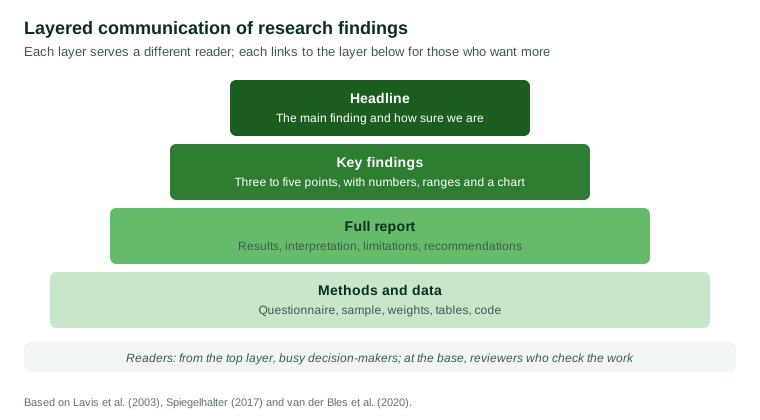
Different readers need different amounts of detail. A layered approach serves them all. A short headline states the main finding and how certain it is. Key findings give the most important results with numbers and a chart. A full report sets out results, interpretation and limitations. Methods and data allow specialists to check the work. Each layer should lead to the next, so that any reader who doubts a claim can find the evidence behind it.
Communicating numbers and uncertainty
How numbers are presented affects how well they are understood. Gigerenzer and Hoffrage (1995) found that people reasoned much more accurately about probabilities when information was presented as natural frequencies, such as "8 out of 1,000 people", than as percentages or conditional probabilities. Spiegelhalter (2017) reviewed research on communicating risk and recommended using frequencies, consistent denominators, absolute rather than only relative changes, and plain statements of the quality of the evidence.
Researchers sometimes fear that admitting uncertainty will undermine trust. Van der Bles et al. (2020) tested this in experiments with thousands of people. When uncertainty around a figure was communicated as a numerical range, trust in the number and its source fell only slightly, while people correctly understood that the figure was uncertain. Vague verbal statements of uncertainty had more negative effects. Honest, specific statements of uncertainty, in other words, are compatible with trust.
Effective charts
Charts can make patterns clear at a glance or hide them. Cleveland and McGill (1984) tested how accurately people read different kinds of graphical encodings and found that judgements of position along a common scale, as in bar and dot charts, were more accurate than judgements of angle, area or colour, as in pie charts and shaded maps. Tufte (2001) urged designers to show the data clearly, avoid decoration that carries no information and never distort the scale of effects. A good chart has a title that states its message, labelled axes, a clear source and an indication of uncertainty where it matters.
Reaching decision-makers
Weiss (1979) showed that research rarely influences decisions in a simple, direct way. More often it shapes how problems are understood over time, or is used to support positions already taken. Oliver et al. (2014) systematically reviewed studies of how policymakers use evidence and found that the most important factors were the availability of timely and relevant research, collaboration and personal relationships between researchers and policymakers, and the clarity of the findings. Nutley et al. (2007) reached similar conclusions: evidence is used when it is relevant to current concerns, delivered by trusted people and presented in usable forms. Fischhoff (2013) emphasised that effective communication starts by learning what audiences already believe and what they need to know, rather than by deciding what experts want to say.
Choosing channels
The same finding may need several channels. A briefing in person allows decision-makers to ask questions and is often the most effective way to deliver findings that challenge current plans. A short written summary can be forwarded to colleagues who were not present. A full report on a website provides a lasting public record that others can cite. Interactive tables allow specialists to explore results for the groups and regions that matter to them. Articles, presentations at conferences and media coverage reach wider audiences, but they also give the organisation less control over how findings are described, so clear summaries and accessible methods notes are especially important when results are likely to be reported by others.
Communicating with participants
The people who provided the data are an audience too. Sharing a short summary of results with participants, where they wish to receive it, shows respect for the time they gave and lets them see what their answers contributed to. It also builds the trust on which future research depends. Such summaries should be written in plain language, avoid technical detail and present results only in aggregate, so that no individual can be identified.
Practical principles
- Plan dissemination at the start, when audiences and decisions can still shape the design of the study.
- Lead with the main message and state how confident you are in it.
- Use plain language and explain technical terms.
- Present numbers as frequencies and give ranges for uncertainty.
- Choose charts that use position and length, and label them fully.
- Deliver on the decision-maker's timetable and through trusted messengers.
- Link every summary to its sources, so that claims can be checked.
- Evaluate whether the knowledge reached its audience and was used.
Conclusion
Communication completes the generation of knowledge. It answers the questions of what to say, to whom, by whom, how and with what effect. Layered reporting serves readers with different needs, natural frequencies and honest ranges make numbers understandable without losing trust, and clear charts reveal patterns without distortion. Above all, knowledge is used when it is relevant, timely and delivered by people decision-makers trust. Organisations that build communication into their work from the start ensure that what they learn makes a difference.
References
Cleveland, W. S., & McGill, R. (1984). Graphical perception: Theory, experimentation, and application to the development of graphical methods. Journal of the American Statistical Association, 79(387), 531–554. https://doi.org/10.1080/01621459.1984.10478080
Fischhoff, B. (2013). The sciences of science communication. Proceedings of the National Academy of Sciences, 110(Suppl. 3), 14033–14039. https://doi.org/10.1073/pnas.1213273110
Gigerenzer, G., & Hoffrage, U. (1995). How to improve Bayesian reasoning without instruction: Frequency formats. Psychological Review, 102(4), 684–704. https://doi.org/10.1037/0033-295X.102.4.684
Graham, I. D., Logan, J., Harrison, M. B., Straus, S. E., Tetroe, J., Caswell, W., & Robinson, N. (2006). Lost in knowledge translation: Time for a map? Journal of Continuing Education in the Health Professions, 26(1), 13–24. https://doi.org/10.1002/chp.47
Lavis, J. N., Robertson, D., Woodside, J. M., McLeod, C. B., Abelson, J., & the Knowledge Transfer Study Group. (2003). How can research organizations more effectively transfer research knowledge to decision makers? The Milbank Quarterly, 81(2), 221–248. https://doi.org/10.1111/1468-0009.t01-1-00052
Nutley, S. M., Walter, I., & Davies, H. T. O. (2007). Using evidence: How research can inform public services. Policy Press.
Oliver, K., Innvar, S., Lorenc, T., Woodman, J., & Thomas, J. (2014). A systematic review of barriers to and facilitators of the use of evidence by policymakers. BMC Health Services Research, 14, Article 2. https://doi.org/10.1186/1472-6963-14-2
Spiegelhalter, D. (2017). Risk and uncertainty communication. Annual Review of Statistics and Its Application, 4, 31–60. https://doi.org/10.1146/annurev-statistics-010814-020148
Tufte, E. R. (2001). The visual display of quantitative information (2nd ed.). Graphics Press.
van der Bles, A. M., van der Linden, S., Freeman, A. L. J., & Spiegelhalter, D. J. (2020). The effects of communicating uncertainty on public trust in facts and numbers. Proceedings of the National Academy of Sciences, 117(14), 7672–7683. https://doi.org/10.1073/pnas.1913678117
Weiss, C. H. (1979). The many meanings of research utilization. Public Administration Review, 39(5), 426–431. https://doi.org/10.2307/3109916