
The Generation of Knowledge · Trust, quality and the future
Documentation as Infrastructure for Trustworthy Knowledge
Why documentation is the hidden infrastructure on which trustworthy knowledge depends, what happens when it is missing, the standards and tools that support it in research, statistics and data science, and how research organisations can document their work so that findings can be checked, reused and trusted.
Every finding rests on a long chain of decisions: who was studied, what they were asked, how answers were recorded, which cases were excluded, how results were weighted and which calculations were made. Readers of a report usually see only the end of this chain. Whether they can trust the finding depends on whether the rest of the chain was recorded, so that someone could, if necessary, follow it back. That record is documentation. It is easy to treat documentation as an administrative chore, done at the end of a project if time allows. This article argues that it is better understood as infrastructure: an underlying structure on which the trustworthiness, reuse and correction of knowledge all depend.
Documentation as infrastructure
Star and Ruhleder (1996) described the characteristics of infrastructure. It is embedded in other structures and practices; it is transparent to use, supporting tasks without needing to be reinvented each time; it extends beyond a single event or site; it is learned as part of membership in a community; and it embodies shared standards. Above all, they observed, infrastructure becomes visible when it breaks. People notice the water supply or the electricity grid mainly when it fails.
Documentation behaves in the same way. When it is good, no one thinks about it: a researcher opens a dataset, reads the codebook and understands what each variable means. When it is missing, the failure is sudden and often irreparable. A dataset without a codebook may be useless; an analysis without a record of the steps taken may be impossible to reproduce; a survey result without the question wording may be impossible to interpret.
Bowker and Star (1999) showed that classification systems, such as the categories used to record diseases, occupations or ethnicity, are a form of infrastructure that shapes what can be known. Decisions about categories are built into data and documentation and then become invisible, yet they determine what can later be counted and compared. Edwards (2010), in his history of climate science, described the enormous effort required to make weather records from different times and places comparable, and introduced the term metadata friction for the difficulty of reconstructing how old data were produced when that information had not been recorded.
When documentation fails
Several well-known failures show the cost of poor documentation.
In 1999, the Mars Climate Orbiter was lost as it approached Mars. The investigation found that one team's software had produced results in imperial units while another team's software expected metric units, and that the difference had not been caught (NASA, 1999). The failure was one of specification and documentation: the units of a key quantity had not been clearly recorded and checked at the point where the work of two teams met.
In economics, Herndon et al. (2014) attempted to reproduce an influential study that had linked high levels of public debt to sharply lower economic growth. Using the original spreadsheet, which the authors had shared, they found a coding error that excluded several countries from a key calculation, as well as choices about which data to exclude and how to weight countries that had not been clearly explained. Once these were corrected, the relationship was much weaker than reported. The study had been widely cited in debates about government spending.
In genomics, Baggerly and Coombes (2009) tried to reproduce studies that claimed to predict which cancer patients would respond to particular drugs. They found that sample labels had been switched, genes misaligned and data from different sources mixed up. Because the original analyses were poorly documented, the errors took years of what they called "forensic bioinformatics" to uncover, and clinical trials based on the work were eventually stopped.
These cases share a pattern. The errors themselves were ordinary, the kind that any team can make. What allowed them to persist was that the steps between raw data and published result were not documented clearly enough for others, or for the original authors, to check.
Documentation and reproducibility
Peng (2011) argued that, in computational research, the minimum standard for a published result should be reproducibility: other researchers should be able to obtain the same results from the same data using the same code. Reproducibility does not guarantee that a result is correct, but without it, errors cannot be found.
Stodden et al. (2018) tested how well this standard was met. They examined articles published in the journal Science after it adopted a policy requiring authors to make data and code available on request. For many articles, they could not obtain the materials, and among those for which materials were obtained, they could reproduce the results for only a portion. Hardwicke et al. (2018) studied the effect of a mandatory open data policy at the journal Cognition and found that, although much more data were shared, many datasets were not reusable without further information, and a number of reported results could not be reproduced without help from the original authors. Sharing data, in other words, is not enough. Data must be accompanied by documentation that allows others to understand and use them.
Sandve et al. (2013) proposed ten simple rules for reproducible computational research. They include keeping track of how every result was produced, avoiding manual steps in data manipulation, recording the exact versions of software used, keeping raw data and intermediate results, and connecting textual statements to the underlying results. Ellis and Leek (2018) gave similar practical guidance for sharing data with collaborators: provide the raw data, a tidy version of the data, a codebook describing each variable, and an exact description of how the raw data were turned into the tidy data.
Reporting standards
Many fields have developed reporting guidelines that specify what must be documented in published research. The CONSORT statement sets out the items that reports of randomised trials should include (Schulz et al., 2010), and the PRISMA statement does the same for systematic reviews (Moher et al., 2009). These guidelines arose because reviews of published research repeatedly found that essential information was missing. Glasziou et al. (2014) estimated that a large proportion of biomedical research reports were incomplete or unusable, for example because they did not describe interventions in enough detail for them to be replicated, or because outcomes were not fully reported, and they argued that this represented a large and avoidable waste of research investment.
In survey research, professional bodies require the disclosure of key methodological information. The code of the American Association for Public Opinion Research requires researchers to disclose, among other things, who sponsored and conducted a survey, the exact wording of questions, the population studied, how the sample was selected, the method of data collection, the dates of fieldwork, the sample size and the precision of results, and how the data were weighted (American Association for Public Opinion Research, 2021). International standards for market, opinion and social research set similar requirements for documenting projects (International Organization for Standardization, 2019).
Documentation standards for data
Standards make documentation consistent and machine-readable. The Data Documentation Initiative (DDI) provides a detailed standard for describing social science data, covering studies, questionnaires, variables, samples and methods (Vardigan et al., 2008). Statistical agencies also publish quality guidelines that describe how data and methods should be documented. Statistics Canada's quality guidelines, for example, set out practices for documenting every stage of a statistical programme, from the definition of concepts to the dissemination of results, so that users can assess whether the data are fit for their purposes (Statistics Canada, 2019).
In data science and machine learning, similar ideas have emerged more recently. Gebru et al. (2021) proposed datasheets for datasets: standard documents that describe why a dataset was created, what it contains, how it was collected and processed, what it should and should not be used for, and how it will be maintained. They drew an analogy with the datasheets that accompany electronic components, which describe their operating characteristics and limits. Mitchell et al. (2019) proposed model cards, short documents that accompany trained models and report how they perform for different groups of people and under different conditions. Both proposals aim to ensure that users of data and models understand their origins and limitations.
Wilkinson et al. (2016) set out the FAIR principles, which call for data to be findable, accessible, interoperable and reusable. Each depends on documentation. Data cannot be found without descriptive metadata, cannot be interoperable without shared definitions, and cannot be reused without information about how they were produced.
Process documentation and paradata
Documentation should record not only what was done but how it went. In survey research, paradata are data about the process of data collection: when interviews took place, how many attempts were needed to reach each respondent, how long each question took to answer, and which answers were changed. Kreuter (2013) described how paradata can be used to monitor fieldwork, detect problems with questions or interviewers, and adjust for nonresponse. Paradata are a form of automatic documentation that captures details no one would remember to write down.
Documentation as a habit
Documentation works best when it is part of the work rather than an afterthought. Gawande (2009) described how simple checklists, used at critical moments, reduce errors in complex work such as surgery and aviation. Haynes et al. (2009) tested a surgical safety checklist in eight hospitals in different countries and found that its introduction was followed by substantial reductions in deaths and complications. Checklists work in part because they force people to record and confirm key facts at the moment they matter, rather than relying on memory.
Borgman (2015) studied how researchers in different fields manage their data and found that documentation practices vary widely and depend heavily on the norms of each community. Where documentation is expected, rewarded and supported by tools, researchers do it well. Where it is not, data quickly become unusable, even to the people who collected them.
Documentation in a survey project
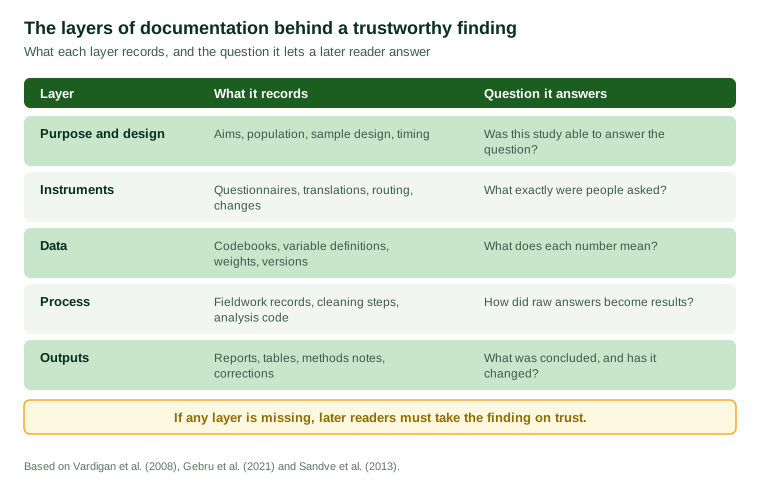
A survey project shows what complete documentation involves in practice. At the design stage, the team records the purpose of the study, the decisions it is meant to inform, the target population, the sampling frame and the sample design, along with the reasons for each choice. The questionnaire is kept in every version, with notes on what was changed after testing and why, and translations are stored with a record of who produced and checked them. During fieldwork, the team records the dates of collection, the number of people invited and the number who responded, and any problems that arose, such as a question that confused respondents or a technical fault. After fieldwork, every step in cleaning the data is recorded: which cases were removed and why, how open answers were coded, how missing values were treated and how weights were calculated. The analysis is carried out in scripts that can be run again. Finally, the report states its methods and limitations, and each table can be traced to the code and data that produced it. None of these steps is difficult. What makes documentation hard is doing all of them consistently, under deadline pressure, on every project.
Versions and corrections
Knowledge changes, and documentation must record how. Datasets are revised when errors are found or new information arrives; reports are corrected; questionnaires evolve from one wave of a survey to the next. Without careful version control, users may not know which version of a dataset they used or whether a figure they cited has since been corrected. Good practice gives each version of a dataset or report a clear identifier and date, keeps earlier versions available, and records what changed between versions and why. Corrections should be published openly and linked to the original, so that anyone who relied on the earlier figure can see that it has changed.
Costs and incentives
Documentation takes time, and its benefits often go to other people, such as later users of the data, or to the same people at a later date, when they have forgotten what they did. This makes it easy to neglect. Organisations can change the balance by building documentation into their standard templates and tools, by allowing time for it in project plans and budgets, and by treating complete documentation as part of the definition of a finished project rather than an optional extra.
Implications for research organisations
For organisations that produce surveys, statistics and research, documentation is the infrastructure on which trust is built. Several practices follow:
- Document as you go. Record decisions at the time they are made, not at the end of a project, when details have been forgotten.
- Document every layer. Keep records of the study's purpose and design, the exact questionnaires used, the data and codebooks, the steps from raw data to results, and the outputs and any corrections.
- Automate where possible. Use scripts rather than manual steps to process data, so that the code itself documents what was done, and keep it under version control.
- Use standards. Adopt established standards such as DDI and professional disclosure requirements, so that documentation is complete and consistent.
- Write for a stranger. Documentation should allow someone who was not involved in the project, perhaps years later, to understand and reproduce the work.
- Disclose methods with findings. Publish the essential methodological information alongside results, so that clients and the public can judge their quality.
- Keep documentation with the data. Store documentation together with the data it describes, and preserve both.
Conclusion
Documentation is infrastructure. Like other infrastructure, it is mostly invisible when it works and becomes visible only when it fails. Failures caused by missing or poor documentation, from lost spacecraft to flawed economic and medical research, show that ordinary errors become dangerous when no one can trace how results were produced. Reporting guidelines, data standards, datasheets, paradata and checklists all aim to make the chain from data to findings visible and checkable. For research organisations, documenting every layer of their work is not a burden added to the production of knowledge. It is part of what makes their findings knowledge rather than assertion.
References
American Association for Public Opinion Research. (2021). AAPOR code of professional ethics and practices. AAPOR.
Baggerly, K. A., & Coombes, K. R. (2009). Deriving chemosensitivity from cell lines: Forensic bioinformatics and reproducible research in high-throughput biology. The Annals of Applied Statistics, 3(4), 1309–1334. https://doi.org/10.1214/09-AOAS291
Borgman, C. L. (2015). Big data, little data, no data: Scholarship in the networked world. MIT Press.
Bowker, G. C., & Star, S. L. (1999). Sorting things out: Classification and its consequences. MIT Press.
Edwards, P. N. (2010). A vast machine: Computer models, climate data, and the politics of global warming. MIT Press.
Ellis, S. E., & Leek, J. T. (2018). How to share data for collaboration. The American Statistician, 72(1), 53–57. https://doi.org/10.1080/00031305.2017.1375987
Gawande, A. (2009). The checklist manifesto: How to get things right. Metropolitan Books.
Gebru, T., Morgenstern, J., Vecchione, B., Vaughan, J. W., Wallach, H., Daumé, H., III, & Crawford, K. (2021). Datasheets for datasets. Communications of the ACM, 64(12), 86–92. https://doi.org/10.1145/3458723
Glasziou, P., Altman, D. G., Bossuyt, P., Boutron, I., Clarke, M., Julious, S., Michie, S., Moher, D., & Wager, E. (2014). Reducing waste from incomplete or unusable reports of biomedical research. The Lancet, 383(9913), 267–276. https://doi.org/10.1016/S0140-6736(13)62228-X
Hardwicke, T. E., Mathur, M. B., MacDonald, K., Nilsonne, G., Banks, G. C., Kidwell, M. C., Hofelich Mohr, A., Clayton, E., Yoon, E. J., Henry Tessler, M., Lenne, R. L., Altman, S., Long, B., & Frank, M. C. (2018). Data availability, reusability, and analytic reproducibility: Evaluating the impact of a mandatory open data policy at the journal Cognition. Royal Society Open Science, 5(8), 180448. https://doi.org/10.1098/rsos.180448
Haynes, A. B., Weiser, T. G., Berry, W. R., Lipsitz, S. R., Breizat, A.-H. S., Dellinger, E. P., Herbosa, T., Joseph, S., Kibatala, P. L., Lapitan, M. C. M., Merry, A. F., Moorthy, K., Reznick, R. K., Taylor, B., & Gawande, A. A. (2009). A surgical safety checklist to reduce morbidity and mortality in a global population. New England Journal of Medicine, 360(5), 491–499. https://doi.org/10.1056/NEJMsa0810119
Herndon, T., Ash, M., & Pollin, R. (2014). Does high public debt consistently stifle economic growth? A critique of Reinhart and Rogoff. Cambridge Journal of Economics, 38(2), 257–279. https://doi.org/10.1093/cje/bet075
International Organization for Standardization. (2019). Market, opinion and social research, including insights and data analytics: Vocabulary and service requirements (ISO Standard No. 20252:2019). ISO.
Kreuter, F. (Ed.). (2013). Improving surveys with paradata: Analytic uses of process information. Wiley. https://doi.org/10.1002/9781118596869
Mitchell, M., Wu, S., Zaldivar, A., Barnes, P., Vasserman, L., Hutchinson, B., Spitzer, E., Raji, I. D., & Gebru, T. (2019). Model cards for model reporting. In Proceedings of the Conference on Fairness, Accountability, and Transparency (pp. 220–229). Association for Computing Machinery. https://doi.org/10.1145/3287560.3287596
Moher, D., Liberati, A., Tetzlaff, J., Altman, D. G., & The PRISMA Group. (2009). Preferred reporting items for systematic reviews and meta-analyses: The PRISMA statement. PLoS Medicine, 6(7), e1000097. https://doi.org/10.1371/journal.pmed.1000097
NASA. (1999). Mars Climate Orbiter Mishap Investigation Board phase I report. National Aeronautics and Space Administration.
Peng, R. D. (2011). Reproducible research in computational science. Science, 334(6060), 1226–1227. https://doi.org/10.1126/science.1213847
Sandve, G. K., Nekrutenko, A., Taylor, J., & Hovig, E. (2013). Ten simple rules for reproducible computational research. PLoS Computational Biology, 9(10), e1003285. https://doi.org/10.1371/journal.pcbi.1003285
Schulz, K. F., Altman, D. G., & Moher, D. (2010). CONSORT 2010 statement: Updated guidelines for reporting parallel group randomised trials. BMJ, 340, c332. https://doi.org/10.1136/bmj.c332
Star, S. L., & Ruhleder, K. (1996). Steps toward an ecology of infrastructure: Design and access for large information spaces. Information Systems Research, 7(1), 111–134. https://doi.org/10.1287/isre.7.1.111
Statistics Canada. (2019). Statistics Canada quality guidelines (6th ed., Catalogue No. 12-539-X). Statistics Canada.
Stodden, V., Seiler, J., & Ma, Z. (2018). An empirical analysis of journal policy effectiveness for computational reproducibility. Proceedings of the National Academy of Sciences, 115(11), 2584–2589. https://doi.org/10.1073/pnas.1708290115
Vardigan, M., Heus, P., & Thomas, W. (2008). Data Documentation Initiative: Toward a standard for the social sciences. International Journal of Digital Curation, 3(1), 107–113. https://doi.org/10.2218/ijdc.v3i1.45
Wilkinson, M. D., Dumontier, M., Aalbersberg, Ij. J., Appleton, G., Axton, M., Baak, A., Blomberg, N., Boiten, J.-W., da Silva Santos, L. B., Bourne, P. E., Bouwman, J., Brookes, A. J., Clark, T., Crosas, M., Dillo, I., Dumon, O., Edmunds, S., Evelo, C. T., Finkers, R., … Mons, B. (2016). The FAIR Guiding Principles for scientific data management and stewardship. Scientific Data, 3, Article 160018. https://doi.org/10.1038/sdata.2016.18