
Surveys · Sampling
Stratified Sampling for Business Research: Gains in Precision and Efficiency
Stratified sampling divides a population into groups and samples each one separately. In business research, where firms and customers differ enormously in size and value, it can multiply the precision of a survey for the same cost. This article explains how to form strata, allocate the sample and analyse the results.
Business populations are lopsided. In most industries a small number of large firms account for a large share of revenue, employment or purchasing, while thousands of small firms account for the rest. Customer bases look similar: a few accounts generate much of the income. A simple random sample from such a population is inefficient. It will include many small units that contribute little to totals and, by chance, may include few or none of the large units that matter most.
Stratified sampling addresses this problem. The population is divided into groups, called strata, and a separate sample is drawn from each. By choosing the strata and the number sampled in each well, researchers can obtain much more precise estimates than a simple random sample of the same size, and can guarantee enough cases in each group for separate analysis (Cochran, 1977; Lohr, 2022). This article explains how stratification works, why it is so effective in business research and how to use it well.
Origins
Stratification is one of the oldest ideas in survey sampling. Early statistical offices often divided countries into districts and sampled within each, but without a theory of how to allocate the sample or measure precision. Neyman (1934) supplied that theory, comparing stratified random sampling with purposive selection and deriving the optimal allocation that now carries his name. In the following decades, statisticians at the United States Census Bureau applied these ideas to large surveys of households, farms and businesses, and their work set out the methods still used for business statistics (Hansen et al., 1953). Textbooks on sampling since then have treated stratification as a basic tool of survey design (Kalton, 1983; Thompson, 2012).
How stratification works
In a stratified design, every unit in the population belongs to exactly one stratum. The strata are defined using information available for every unit on the sampling frame, such as industry, region, number of employees or annual sales. A probability sample, usually a simple random or systematic sample, is drawn independently within each stratum. Estimates are first made for each stratum and then combined, weighting each stratum by its share of the population (Kish, 1965).
The precision of a stratified estimate depends only on the variability within strata, not between them. Differences between strata are removed by the design, because each stratum is represented by exactly the planned number of units. The more homogeneous the units within each stratum, and the more different the strata from each other, the greater the gain in precision (Cochran, 1977).
Why stratify?
Stratification serves four purposes, which often apply together in business surveys.
- Precision. When strata differ on the survey variables, a stratified sample gives smaller standard errors than a simple random sample of the same size.
- Guaranteed coverage of groups. Every stratum is represented, so small but important groups, such as large firms or a minor region, cannot be missed by chance.
- Separate estimates. The researcher controls the sample size in each stratum, so results can be produced for each group with known precision.
- Administrative convenience. Different strata can be surveyed with different methods, for example personal contact for large firms and online questionnaires for small ones (Cox et al., 1995; Snijkers et al., 2013).
Choosing stratification variables
Good stratification variables are known for every unit on the frame and strongly related to the main survey variables. In business surveys, size is almost always the most important. A firm's number of employees or its revenue in a previous year is usually closely related to its current revenue, investment or purchasing, which are typical survey targets. Industry and region are commonly added, both because they are related to many outcomes and because results are often needed for each industry and region (Snijkers et al., 2013).
In customer research, strata might be formed by customer value, product line, tenure or channel. In employee surveys, department, grade and location are common. The principle is the same: use what is known in advance to group similar units together.
The number of strata involves a trade-off. More strata can increase precision, but each stratum needs at least two sampled units to estimate variance, and very fine stratification yields diminishing returns. Cochran (1977) noted that, for stratification on a single size variable, most of the achievable gain is obtained with around five or six strata.
Setting stratum boundaries
When a continuous variable such as revenue is used, the researcher must decide where to draw the boundaries between strata. Dalenius and Hodges (1959) proposed a widely used rule, the cumulative square root of frequency method, that approximates the boundaries giving minimum variance. For highly skewed business populations, Lavallée and Hidiroglou (1988) developed an algorithm that sets boundaries and allocates the sample together, including a top stratum in which all units are taken. Software now implements these and related methods (Baillargeon & Rivest, 2011).
Allocating the sample
Once strata are formed, the researcher must decide how many units to sample from each. This allocation is where most of the gains in business surveys come from.
Proportional allocation
Under proportional allocation, each stratum receives a share of the sample equal to its share of the population. If small firms make up 90 per cent of the population, they receive 90 per cent of the sample. Proportional allocation always gives at least as much precision as simple random sampling, apart from small effects in tiny samples, and it is self-weighting: every unit has the same probability of selection, which keeps analysis simple (Kish, 1965).
Optimal (Neyman) allocation
Neyman (1934) showed that, for a fixed total sample, the most precise estimate of a population mean or total is obtained by allocating the sample in proportion to the size of each stratum multiplied by its standard deviation. Strata that are larger, more variable or both receive more sample. If costs differ between strata, the allocation can also take costs into account, giving more sample to strata where interviews are cheaper (Cochran, 1977).
In business populations, the variability of revenue or employment is usually far greater among large firms than among small ones. Optimal allocation therefore often gives large firms a share of the sample many times larger than their share of the population.
Take-all strata
Sometimes optimal allocation calls for more units than a stratum contains. This happens frequently with the largest firms. The solution is a take-all or certainty stratum: every unit in it is included, and the remaining sample is allocated optimally among the other strata (Hidiroglou, 1986). Because every unit in a take-all stratum is observed, it contributes no sampling error at all. Most official business surveys use a take-all stratum for the largest enterprises.
Allocation for several purposes
Real surveys measure several variables and need estimates for several groups. An allocation that is optimal for revenue may be poor for employment, and an allocation that is optimal for the national total may leave too few units in small regions. Methods exist for finding allocations that meet precision targets for several variables at the lowest total cost (Bethel, 1989). In practice, many surveys use a compromise: a minimum sample size in every stratum to support separate estimates, with the remainder allocated optimally for the main variables (Valliant et al., 2018).
An illustration
Consider a population of 10,000 firms in three size groups: 9,000 small firms, 900 medium firms and 100 large firms. Suppose average annual revenue is 1 million dollars for small firms, 5 million for medium firms and 60 million for large firms, with standard deviations of 0.5, 3 and 40 million respectively. A survey of 1,000 firms aims to estimate total revenue (illustrative figures).
Figure 1 compares two allocations. Proportional allocation samples 900 small, 90 medium and 10 large firms. Optimal allocation would assign more large firms than exist, so all 100 large firms are taken and the remaining 900 interviews are divided between small and medium firms in proportion to their size multiplied by their standard deviation, giving about 563 small and 337 medium firms.
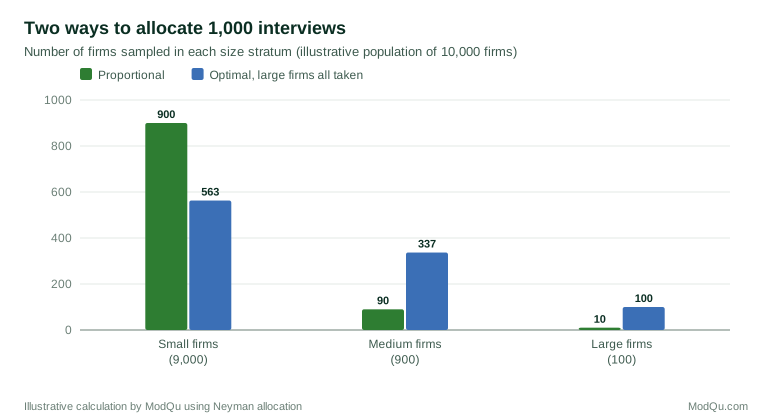
Figure 2 shows what these choices mean for precision. A simple random sample of 1,000 firms would estimate total revenue with a standard error of about 2.3 billion dollars. Proportional stratification removes the variation between size groups and reduces this to about 1.3 billion. Optimal allocation with a take-all stratum reduces it to about 0.24 billion, roughly one tenth of the simple random sample's error, for the same number of interviews (illustrative figures).
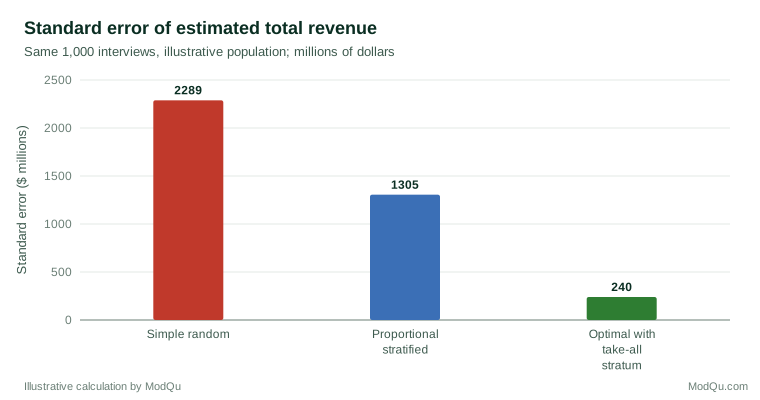
To match the precision of the optimal design, a simple random sample would need roughly 90 times as many interviews, more than the whole population. This is why stratification by size, with a take-all stratum, is standard in business statistics (Cox et al., 1995).
Weighting and estimation
When the sample is not allocated proportionally, units in different strata have different chances of selection. In the illustration, every large firm is selected, about one in sixteen small firms is selected and about three in eight medium firms are selected. Estimates must reflect this. Each sampled unit is given a weight equal to the inverse of its selection probability, so that a sampled small firm represents about 16 small firms and each large firm represents only itself (Horvitz & Thompson, 1952).
The stratified estimate of a total is the sum, over strata, of each stratum's estimated total. The estimated mean is the total divided by the population size. The standard error is calculated from the variances within each stratum, which is why survey analysis software must be told which stratum each unit belongs to. Ignoring the stratification in analysis usually overstates the standard error, and ignoring the weights can give badly biased estimates (Lumley, 2010). In the illustration, an unweighted average of the sample would give large firms ten per cent of the influence on the result when they make up only one per cent of the population, so the unweighted average revenue would be far too high. Reports should state that results are weighted and describe the weighting so that readers can judge them.
Further gains are possible by using auxiliary information at the estimation stage. Ratio and regression estimators, and more generally calibration estimators, adjust the weights so that sample estimates of auxiliary totals, such as last year's revenue, match their known population values (Deville & Särndal, 1992; Särndal et al., 1992). In business surveys with good register information, these methods often add substantial precision on top of stratification.
Stratifying after the sample is drawn
Sometimes the information needed for stratification is not on the frame but is collected in the survey, such as the respondent's age or the firm's actual industry. Post-stratification weights the sample after data collection so that each group matches its known population share. It captures much of the precision gain of stratification and helps correct for differences in response between groups, though it does not control the sample size in each group in advance (Holt & Smith, 1979; Kalton & Flores-Cervantes, 2003).
Design effects of stratified samples
The effect of a stratified design on precision can be summarised by its design effect, the ratio of its variance to that of a simple random sample of the same size (Kish, 1965). Proportionate stratification produces a design effect at or slightly below 1. Disproportionate allocation can produce a design effect well below 1 for the variables it was optimised for, as in the illustration, but above 1 for other variables, because the unequal weights add variance when they are not matched by differences in variability. Kish (1995) showed how to approximate the effect of unequal weights, which helps designers see the cost of over-sampling some strata for variables that do not vary much between them. A survey designed to estimate total revenue precisely may therefore be less efficient than a simple random sample for estimating, say, the share of firms that plan to hire staff. Designers should check precision for all the key variables, not only the one used in the allocation.
Very small strata
Each stratum must contain at least two sampled units for its variance to be estimated. Designs with many strata sometimes end up with only one responding unit in a stratum, especially after nonresponse. The usual remedy is to collapse such strata with similar neighbouring strata for variance estimation, which tends to overstate the variance slightly but keeps estimates usable (Kalton, 1983; Levy & Lemeshow, 2008). Planning a minimum sample of several units per stratum avoids the problem.
Practical issues in business surveys
Out-of-date frames
Business registers age quickly. Firms grow, shrink, merge, close and change industry. A firm classified as small when the frame was built may now be large, and its weight, designed for a small firm, can then make it dominate estimates. Survey organisations handle such stratum jumpers with methods such as capping or adjusting their weights, and by refreshing the frame regularly (Snijkers et al., 2013).
Nonresponse in key strata
Nonresponse among large firms is particularly damaging, because each one represents a large share of the total. Business surveys therefore concentrate follow-up effort on the take-all stratum, often with personal contact and account management. For smaller strata, nonresponse is usually handled by weighting within strata (Cox et al., 1995).
Respondent burden
Large firms in take-all strata are selected for many surveys and every survey occasion. To spread burden, statistical agencies use coordinated sampling methods and rotation for smaller firms, so that the same small business is not selected again and again (Tillé, 2006; Snijkers et al., 2013).
Steps for a stratified customer survey
A typical stratified customer survey follows these steps. First, the team defines the population, for example all active business accounts, and checks that the customer database contains the stratification variables for every account. Second, it forms strata, usually by value band and product line, and sets a minimum number of completed interviews for each stratum that will be reported separately. Third, it allocates the remaining sample towards the strata where answers are expected to vary most, which in customer research are often the high-value accounts. Fourth, it estimates response rates for each stratum from past surveys and issues enough sample in each to reach the targets. Finally, after fieldwork, it calculates weights within each stratum, adjusts them for nonresponse and analyses the data with software that recognises the strata (Groves et al., 2009; Valliant et al., 2018).
Stratification in customer and employee research
The same principles apply outside formal business statistics. A company surveying its customers might stratify by annual spend, so that high-value accounts are sampled heavily and their views are measured precisely, while still sampling low-value customers to represent the many. An employee survey might stratify by department to ensure each one has enough respondents for its own report. In both cases, the design must be reflected in the analysis through weights; otherwise the over-sampled groups would dominate overall results.
Common mistakes
- Stratifying on variables that are unrelated to the survey outcomes, which adds complexity without adding precision.
- Using too many strata with too few units in each.
- Over-sampling some strata but analysing the data without weights.
- Treating a take-all stratum as if it had sampling error, or forgetting it when calculating totals.
- Ignoring changes in firm size since the frame was built.
- Allocating optimally for one variable and assuming the design is equally good for all (Bethel, 1989; Valliant et al., 2018).
Checklist
- Identify the main estimates and the groups for which separate results are needed.
- Choose stratification variables that are on the frame and related to the main outcomes, usually including size.
- Set stratum boundaries using a recognised method for skewed populations.
- Create a take-all stratum for the largest units where appropriate.
- Allocate the rest of the sample to balance overall precision and subgroup needs.
- Calculate weights from selection probabilities and adjust for nonresponse within strata.
- Analyse with software that accounts for strata and weights, and report the design (Lumley, 2010).
Conclusion
Stratified sampling is one of the most powerful tools available to survey designers, and its advantages are greatest in business research, where populations are highly skewed and a few units account for much of the total. By grouping similar units and allocating the sample where variability is greatest, stratification can reduce sampling error several-fold for the same cost, guarantee that key groups are included and support separate results for each group. The gains come with responsibilities: strata must be built from good frame information, the sample must be weighted correctly and the analysis must respect the design. Done well, stratification turns a limited budget into much more precise knowledge (Neyman, 1934; Cochran, 1977; Hansen et al., 1953).
References
Baillargeon, S., & Rivest, L.-P. (2011). The construction of stratified designs in R with the package stratification. Survey Methodology, 37(1), 53–65.
Bethel, J. (1989). Sample allocation in multivariate surveys. Survey Methodology, 15(1), 47–57.
Cochran, W. G. (1977). Sampling techniques (3rd ed.). Wiley.
Cox, B. G., Binder, D. A., Chinnappa, B. N., Christianson, A., Colledge, M. J., & Kott, P. S. (Eds.). (1995). Business survey methods. Wiley. https://doi.org/10.1002/9781118150504
Dalenius, T., & Hodges, J. L., Jr. (1959). Minimum variance stratification. Journal of the American Statistical Association, 54(285), 88–101. https://doi.org/10.1080/01621459.1959.10501501
Deville, J.-C., & Särndal, C.-E. (1992). Calibration estimators in survey sampling. Journal of the American Statistical Association, 87(418), 376–382. https://doi.org/10.1080/01621459.1992.10475217
Groves, R. M., Fowler, F. J., Jr., Couper, M. P., Lepkowski, J. M., Singer, E., & Tourangeau, R. (2009). Survey methodology (2nd ed.). Wiley.
Hansen, M. H., Hurwitz, W. N., & Madow, W. G. (1953). Sample survey methods and theory (Vols. 1–2). Wiley.
Hidiroglou, M. A. (1986). The construction of a self-representing stratum of large units in survey design. The American Statistician, 40(1), 27–31. https://doi.org/10.1080/00031305.1986.10475350
Holt, D., & Smith, T. M. F. (1979). Post stratification. Journal of the Royal Statistical Society: Series A (General), 142(1), 33–46. https://doi.org/10.2307/2344652
Horvitz, D. G., & Thompson, D. J. (1952). A generalization of sampling without replacement from a finite universe. Journal of the American Statistical Association, 47(260), 663–685. https://doi.org/10.1080/01621459.1952.10483446
Kalton, G., & Flores-Cervantes, I. (2003). Weighting methods. Journal of Official Statistics, 19(2), 81–97.
Kalton, G. (1983). Introduction to survey sampling. SAGE. https://doi.org/10.4135/9781412984683
Kish, L. (1965). Survey sampling. Wiley.
Kish, L. (1995). Methods for design effects. Journal of Official Statistics, 11(1), 55–77.
Lavallée, P., & Hidiroglou, M. A. (1988). On the stratification of skewed populations. Survey Methodology, 14(1), 33–43.
Levy, P. S., & Lemeshow, S. (2008). Sampling of populations: Methods and applications (4th ed.). Wiley. https://doi.org/10.1002/9780470374597
Lohr, S. L. (2022). Sampling: Design and analysis (3rd ed.). CRC Press. https://doi.org/10.1201/9780429298899
Lumley, T. (2010). Complex surveys: A guide to analysis using R. Wiley. https://doi.org/10.1002/9780470580066
Neyman, J. (1934). On the two different aspects of the representative method: The method of stratified sampling and the method of purposive selection. Journal of the Royal Statistical Society, 97(4), 558–625. https://doi.org/10.2307/2342192
Snijkers, G., Haraldsen, G., Jones, J., & Willimack, D. K. (2013). Designing and conducting business surveys. Wiley. https://doi.org/10.1002/9781118447895
Särndal, C.-E., Swensson, B., & Wretman, J. (1992). Model assisted survey sampling. Springer. https://doi.org/10.1007/978-1-4612-4378-6
Thompson, S. K. (2012). Sampling (3rd ed.). Wiley. https://doi.org/10.1002/9781118162934
Tillé, Y. (2006). Sampling algorithms. Springer. https://doi.org/10.1007/0-387-34240-0
Valliant, R., Dever, J. A., & Kreuter, F. (2018). Practical tools for designing and weighting survey samples (2nd ed.). Springer. https://doi.org/10.1007/978-3-319-93632-1