
Surveys · Sampling
Quota Sampling in Market Research: Practice, Rationale and Pitfalls
Quota sampling fills target numbers of respondents with chosen characteristics so that a sample matches the population on those characteristics. This article explains how quotas are set, why market research relies on them, what can go wrong and how to use them well.
Walk into almost any market research agency and you will find quotas. A typical brief asks for 1,000 interviews "nationally representative by age, sex and region". The sample is built by recruiting people, usually from an online panel, until the number of respondents in each group matches its share of the population. This is quota sampling, and it has been the working method of commercial and opinion research for most of the last century (Stephan & McCarthy, 1958).
Quotas are fast and cheap and produce samples that look right on the variables they control. But because the people within each group are not selected at random, quota samples carry risks that their neat profiles can hide. This article explains how quota sampling works, why it is so widely used and how to avoid its main pitfalls.
How quotas work
The researcher first chooses the quota variables, usually demographic characteristics known for the population from a census or other reliable source. Common choices are age, sex, region and, increasingly, education. Target numbers are then set for each group in proportion to its population share.
Quotas can be independent, with separate targets for each variable, or interlocking, with targets for each combination, as in Figure 1. Independent quotas are easier to fill but can produce odd combinations, such as the right number of young people and the right number of women but too few young women. Interlocking quotas control combinations but need more cells and are harder to fill (Kish, 1965).
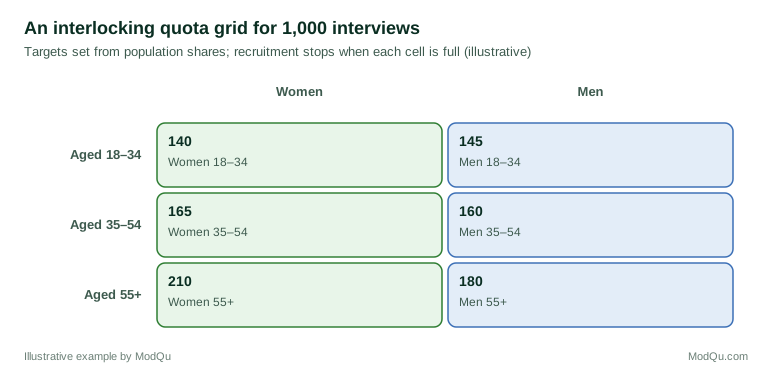
Recruitment then proceeds until each cell is full. In face-to-face research, interviewers approach people in the street or door to door. In online research, panel members are invited, and those who belong to cells that are already full are screened out.
Why market research uses quotas
The appeal is practical. Quota samples avoid the cost of a full sampling frame, the repeated call-backs needed to reach selected people and the low response rates of many probability surveys. Fieldwork can be completed in days. For many commercial questions, such as which of two packaging designs consumers prefer, the main interest is in comparisons, and a sample balanced on key demographics may be adequate.
Quotas also give an appearance of representativeness that clients find reassuring. Tables showing the sample matching the census on age and sex are standard in research reports.
The theory, and its gap
The justification for quota sampling rests on an assumption: within each quota cell, the people who are recruited resemble those who are not, on the variables the survey measures. If this holds, a quota sample behaves much like a stratified random sample. If it does not, the sample can be biased in ways the quotas cannot detect (Moser & Stuart, 1953; Baker et al., 2013).
The assumption often fails. Within a cell such as "women aged 55 and over", the people who are at home during the day, who are willing to stop in the street or who join online panels differ from those who do not, for example in employment, health, political interest or internet use. Interviewers, left to choose whom to approach, tend to select people who look approachable and live in accessible places (Marsh & Scarbrough, 1990).
Sudman (1966) proposed a hybrid in which areas and starting points are selected by probability methods and quotas are used only at the final stage. This reduces interviewer discretion and remains common in face-to-face research.
Lessons from election polling
Elections provide rare tests of quota samples against a known result. In the United States in 1948, polls using quota methods predicted the wrong winner, and the subsequent inquiry identified quota sampling among the causes (Mosteller et al., 1949). In Britain, the polls' failure in 1992 was attributed partly to quota samples that over-represented one party's supporters within the quota cells (Jowell et al., 1993). After the 2015 British general election, an inquiry concluded that the main cause of the polling miss was unrepresentative samples: the people recruited for online and telephone polls, even after quotas and weighting, were more politically engaged and leaned differently from the electorate as a whole (Sturgis et al., 2018).
In each case, the samples matched the population on the quota variables. What failed was the assumption that people within each cell were like everyone else in that cell. Advocates of probability methods argued that only random selection removes this risk (Lynn & Jowell, 1996).
Evidence on accuracy
Comparisons with external benchmarks show that quota-controlled online samples are, on average, less accurate than probability samples, with more variation between providers (Yeager et al., 2011; Cornesse et al., 2020). They do better on the variables used in the quotas, which is by design, and worse on other characteristics. Weighting can reduce the remaining bias when the right variables are available, but cannot remove bias related to factors that are neither in the quotas nor in the weights (Mercer et al., 2017).
Quotas in online panels
Most quota samples today come from online panels. Panel companies recruit members through advertising, partner websites and referrals, and invite them to surveys in exchange for points or small payments. A survey's quotas are applied as members arrive: those who fit an open cell continue, and those whose cell is full are screened out. Several features of this process matter for quality.
First, the pool itself is self-selected. Panel members are people who chose to join and who take part in surveys regularly, and they may differ from the general population in ways no demographic quota captures, such as time spent online or interest in giving opinions (Baker et al., 2013). Second, fast-filling cells are completed by the earliest responders, who may differ from those who respond later. Third, when the last cells are hard to fill, suppliers sometimes draw on other panels or sources, so a single sample may combine people recruited in different ways. Buyers of panel samples should ask how the panel was recruited, how quotas were filled and whether multiple sources were used.
Setting the targets
Quota targets should come from an up-to-date and reliable source, normally a national census or a large official survey, and should describe the same population as the survey. A survey of internet users should use targets for internet users, not for all adults. Where the survey covers a specific group, such as parents of young children or small business owners, reliable population figures may be scarce, and the targets themselves become a source of uncertainty that should be acknowledged in the report.
Using quotas well
Quota sampling is not going to disappear from market research, so the practical question is how to use it responsibly.
- Choose quota variables for the topic, not only for demographics. If the survey is about technology adoption, quotas on internet use or education may matter more than quotas on sex.
- Use interlocking quotas for key combinations where the topic varies across them, such as age by sex for health products.
- Avoid over-tight quotas that force recruitment of the last few hard-to-reach respondents at great cost, often from unrepresentative sources.
- Weight after fieldwork to correct remaining imbalances, using population totals from a reliable source (Kalton & Flores-Cervantes, 2003).
- Check against benchmarks. Include questions whose population values are known, such as household size or newspaper readership, to test how representative the sample is.
- Report honestly. Describe the sample as quota-based, list the quotas and do not quote margins of error as if it were a random sample (Baker et al., 2013).
An example
A beverage company wants to measure awareness of a new drink. The agency proposes an online panel sample of 1,000 adults with quotas on age, sex and region. The company's marketing team knows that awareness is likely to depend strongly on whether people shop at convenience stores, where the drink is sold, and that online panel members may shop differently from other adults. The agency therefore adds a check question on shopping habits, compares the result with industry data and finds that panel members are more likely to use convenience stores. Results are weighted to correct for this, and the report notes that awareness may still be overstated (illustrative example).
Conclusion
Quota sampling makes surveys fast and affordable and produces samples that match the population on chosen characteristics. Its weakness is that it says nothing about who, within each group, ends up in the sample. History, from election polling to benchmark studies, shows that this gap can produce serious errors. Used with care, with quotas and weights chosen for the topic, checks against known figures and honest reporting, quota samples can serve many market research purposes. Used carelessly, they offer the appearance of representativeness without the substance (Moser & Stuart, 1953; Groves et al., 2009).
References
Baker, R., Brick, J. M., Bates, N. A., Battaglia, M., Couper, M. P., Dever, J. A., Gile, K. J., & Tourangeau, R. (2013). Summary report of the AAPOR task force on non-probability sampling. Journal of Survey Statistics and Methodology, 1(2), 90–143. https://doi.org/10.1093/jssam/smt008
Cornesse, C., Blom, A. G., Dutwin, D., Krosnick, J. A., De Leeuw, E. D., Legleye, S., Pasek, J., Pennay, D., Phillips, B., Sakshaug, J. W., Struminskaya, B., & Wenz, A. (2020). A review of conceptual approaches and empirical evidence on probability and nonprobability sample survey research. Journal of Survey Statistics and Methodology, 8(1), 4–36. https://doi.org/10.1093/jssam/smz041
Groves, R. M., Fowler, F. J., Jr., Couper, M. P., Lepkowski, J. M., Singer, E., & Tourangeau, R. (2009). Survey methodology (2nd ed.). Wiley.
Jowell, R., Hedges, B., Lynn, P., Farrant, G., & Heath, A. (1993). The 1992 British election: The failure of the polls. Public Opinion Quarterly, 57(2), 238–263. https://doi.org/10.1086/269369
Kalton, G., & Flores-Cervantes, I. (2003). Weighting methods. Journal of Official Statistics, 19(2), 81–97.
Kish, L. (1965). Survey sampling. Wiley.
Lynn, P., & Jowell, R. (1996). How might opinion polls be improved? The case for probability sampling. Journal of the Royal Statistical Society: Series A (Statistics in Society), 159(1), 21–28. https://doi.org/10.2307/2983465
Marsh, C., & Scarbrough, E. (1990). Testing nine hypotheses about quota sampling. Journal of the Market Research Society, 32(4), 485–506.
Mercer, A. W., Kreuter, F., Keeter, S., & Stuart, E. A. (2017). Theory and practice in nonprobability surveys: Parallels between causal inference and survey inference. Public Opinion Quarterly, 81(S1), 250–271. https://doi.org/10.1093/poq/nfw060
Moser, C. A., & Stuart, A. (1953). An experimental study of quota sampling. Journal of the Royal Statistical Society: Series A (General), 116(4), 349–405. https://doi.org/10.2307/2343021
Mosteller, F., Hyman, H., McCarthy, P. J., Marks, E. S., & Truman, D. B. (1949). The pre-election polls of 1948. Social Science Research Council.
Stephan, F. F., & McCarthy, P. J. (1958). Sampling opinions: An analysis of survey procedure. Wiley.
Sturgis, P., Kuha, J., Baker, N., Callegaro, M., Fisher, S., Green, J., Jennings, W., Lauderdale, B. E., & Smith, P. (2018). An assessment of the causes of the errors in the 2015 UK general election opinion polls. Journal of the Royal Statistical Society: Series A (Statistics in Society), 181(3), 757–781. https://doi.org/10.1111/rssa.12329
Sudman, S. (1966). Probability sampling with quotas. Journal of the American Statistical Association, 61(315), 749–771. https://doi.org/10.1080/01621459.1966.10480903
Yeager, D. S., Krosnick, J. A., Chang, L., Javitz, H. S., Levendusky, M. S., Simpser, A., & Wang, R. (2011). Comparing the accuracy of RDD telephone surveys and internet surveys conducted with probability and non-probability samples. Public Opinion Quarterly, 75(4), 709–747. https://doi.org/10.1093/poq/nfr020