
Surveys · Sampling
Sampling Frames and Coverage Error: Who Is Missing From Your List?
A sampling frame is the list or procedure from which a sample is drawn. When the frame leaves out part of the population, or includes people who should not be there, survey estimates can be biased. This article explains coverage error, how to measure it and how to reduce it.
Every sample is drawn from something. In a telephone survey it might be a list of numbers; in a customer study, a database of accounts; in a household survey, a register of addresses. This list, or the procedure used to identify population members, is the sampling frame. However carefully a sample is selected from it, the sample can represent only the people the frame contains. If the frame leaves out some members of the population, or includes people who should not be there, the survey suffers from coverage error (Groves et al., 2009).
Coverage error is one of the main components of total survey error, alongside sampling error, nonresponse error and measurement error (Groves, 1989; Biemer, 2010). It is often less visible than the others, because the people who are missing from the frame leave no trace in the data. This article explains the types of coverage problems, how they bias estimates and what researchers can do about them.
The target population and the frame
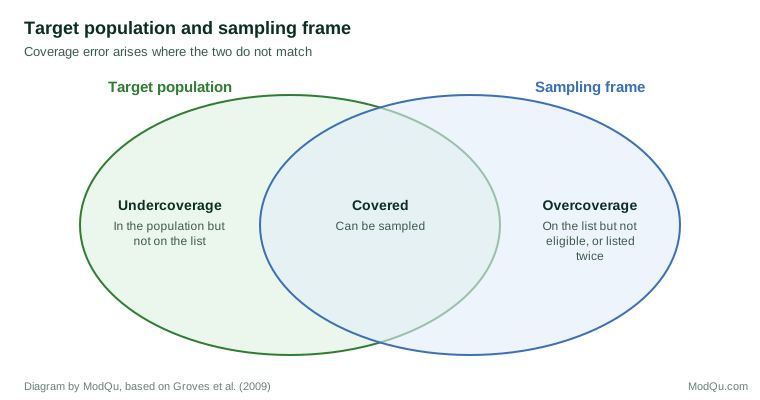
The target population is the group the survey is meant to describe: for example, all adults living in a country, all customers who bought a product in the last year or all employees of a firm. The frame population is the set of people who can actually be reached through the frame. Ideally the two are the same. In practice they rarely are, as Figure 1 shows (Kish, 1965).
Types of coverage problems
Undercoverage
Undercoverage occurs when members of the target population are not on the frame and therefore have no chance of selection. It is the most serious coverage problem, because nothing in the sample can represent those who are missing. Examples include households without a landline in a landline telephone survey, people without internet access in a web survey, new customers not yet entered in a database and people living in institutions or without a fixed address in an address-based survey (Lessler & Kalsbeek, 1992).
Overcoverage
Overcoverage occurs when the frame includes units that are not part of the target population, such as business numbers in a list meant to contain only households, former customers who remain in a database or addresses that are vacant. Ineligible units can usually be identified and screened out during fieldwork, so overcoverage mainly adds cost, but if eligibility is hard to determine, it can also lead to errors (Groves et al., 2009).
Duplicates and clustering
Some population members appear more than once on a frame: a person with two telephone numbers, a customer with two accounts or a household listed under two addresses. These people have a higher chance of selection than others. Conversely, a single frame entry may correspond to several population members, as when one address contains several households. Both problems can be handled by asking respondents how many times they could have been selected and adjusting their weights, but only if the information is collected (Lohr, 2022).
How undercoverage causes bias
Undercoverage creates bias only when the people who are missing differ from those who are covered on the characteristics being measured. The bias in an estimated mean or proportion is approximately the share of the population not covered, multiplied by the difference between covered and non-covered people (Groves et al., 2009).
Figure 2 gives an example. If 85 per cent of the population is on the frame, 62 per cent of covered people shop online weekly and only 38 per cent of non-covered people do, the true population value is 58.4 per cent. A survey of the frame, even a perfect one with full response, would estimate 62 per cent, an overstatement of 3.6 percentage points (illustrative figures).
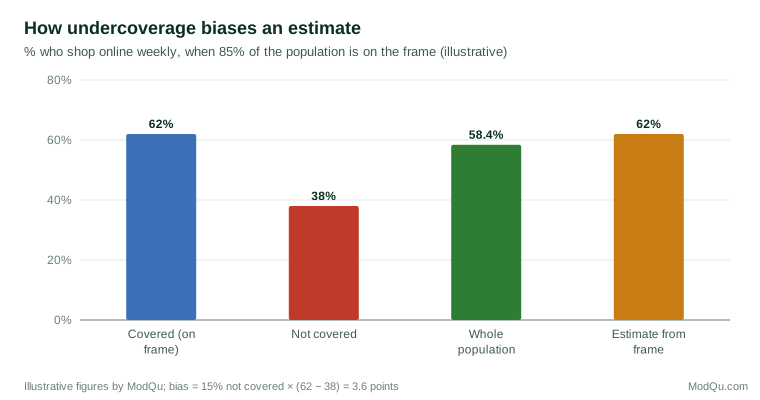
Two lessons follow. Bias grows with both the size of the missing group and how different it is. And increasing the sample size does nothing to reduce it, because every additional respondent comes from the same incomplete frame.
Coverage problems in common survey modes
Telephone surveys
For decades, random-digit dialling of landline numbers covered most households in many countries. As people moved to mobile-only telephone use, landline frames left out a growing share of the population, particularly younger adults and people with lower incomes, and studies showed that this produced bias for some health and behavioural estimates (Blumberg & Luke, 2007). Survey organisations responded by adding mobile telephone frames.
Web surveys
Web surveys can only reach people with internet access, and in most countries there is no complete list of internet users from which to sample. Couper (2000) identified coverage as one of the main challenges for web surveys. Although internet access has grown, a comparison across European countries found that people without access still differed from users in age, education and other characteristics, so coverage bias remained a concern for general population web surveys (Mohorko et al., 2013).
Address-based surveys
Lists of postal addresses have become an important frame for general population surveys in several countries. In the United States, address-based sampling using the postal delivery file was shown to offer high coverage of households, often better than telephone frames, although coverage was weaker in rural areas and for some types of housing (Link et al., 2008; Iannacchione, 2011).
Area listings
Where no list exists, field staff may visit selected areas and list all housing units. Even this traditional method has coverage problems. Listers miss some units, and studies have shown that they can be influenced by an existing list they are asked to update, missing units that the list omitted (Eckman & Kreuter, 2011). In screening interviews, where household members are asked who lives there, respondents sometimes leave people out, particularly when they suspect that naming them will lead to a longer interview (Tourangeau et al., 2012).
Business and customer lists
In business surveys, frames are often internal databases. These are convenient but have their own gaps: customers who buy through resellers, people who share an account, contacts with missing or outdated email addresses and recent customers not yet recorded. The target population should be defined first, and the database checked against it, rather than the other way round.
Measuring coverage
Coverage cannot be judged from the survey data alone, because the missing people are not in it. Three approaches are commonly used. The first compares the frame with an independent and more complete source, such as census counts or an administrative register, to estimate the coverage rate: the share of the target population that appears on the frame. The second compares the weighted sample with known population totals before any adjustment for coverage; large differences on characteristics such as age or housing type suggest coverage gaps. The third uses special studies, such as re-listing a sample of areas or matching a sample of the population to the frame, to count directly how many units the frame misses (Lessler & Kalsbeek, 1992; Groves et al., 2009).
Coverage rates should be estimated for subgroups as well as for the population as a whole. A frame that covers 95 per cent of all adults may cover only 80 per cent of young adults or of people in rented housing, and subgroup gaps are what create bias in estimates that vary by age or tenure.
Coverage changes over time
Frames age. Customer databases accumulate closed accounts, address lists miss new buildings and telephone frames lose value as habits change. The decline of landline coverage shows how a frame that was once nearly complete can become seriously deficient within a decade (Blumberg & Luke, 2007). Organisations that survey the same population repeatedly should therefore review their frames regularly rather than assume that coverage which was adequate in the past remains adequate.
Reducing coverage error
Choose or build a better frame
The most effective step is to use the most complete frame available, or to improve the one in hand by updating records, removing duplicates and adding missing groups. Comparing the frame against independent sources, such as census counts or industry statistics, shows where it is weak (Lessler & Kalsbeek, 1992).
Use more than one frame
When no single frame covers the whole population, two or more frames can be combined, such as landline and mobile telephone lists or an address list and a list of a rare group. Multiple frame designs date back to Hartley (1962) and require care, because people on more than one frame have more than one chance of selection; specialised estimators handle the overlap (Lohr & Rao, 2000).
Adjust with weights
When coverage gaps cannot be closed, weighting can reduce bias by adjusting the sample to known population totals, for example by age, sex and region (Kalton & Flores-Cervantes, 2003; Valliant et al., 2018). This works only to the extent that, within each weighting group, covered and non-covered people are similar. If the missing people differ in ways not captured by the weighting variables, bias remains.
Define the population honestly
Sometimes the best option is to redefine the target population to match the frame and to say so clearly. A survey of "adults with internet access" or "customers with a registered email address" is less ambitious than a survey of all adults or all customers, but it makes no claim it cannot support (Baker et al., 2013).
An example
A bank wants to survey its retail customers about a new mobile app. Its database lists 500,000 customers, but on inspection the research team finds that 6 per cent of records are for closed accounts, 4 per cent are duplicates for people with more than one account and 12 per cent have no email address. An email survey would therefore miss 12 per cent of current customers, and these are disproportionately older customers who are less likely to use the app. The team removes closed accounts and duplicates, and samples customers without email addresses separately by post. Responses from the two modes are combined with weights reflecting each group's share of the customer base. Without these steps, the survey would have overstated app use and satisfaction (illustrative example).
Checklist
- Define the target population precisely before choosing a frame.
- Compare the frame with the target population and estimate the share missing.
- Remove duplicates and ineligible units, or record how many times each person could be selected.
- Consider whether the missing groups are likely to differ on the survey topics.
- Use multiple frames or modes to cover important gaps.
- Weight to population totals, but do not assume weighting removes all coverage bias.
- Report the frame used, its known gaps and how they were handled (Dillman et al., 2014).
Conclusion
The sampling frame sets the limit on what a survey can represent. Undercoverage, overcoverage and duplication all affect estimates, and undercoverage is the most dangerous because the missing people leave no trace. The bias it causes depends on how many people are missing and how different they are, not on the size of the sample. Choosing the best available frame, combining frames, adjusting with weights and being honest about the population actually covered are the main ways to keep coverage error under control (Groves et al., 2009; Lohr, 2022).
References
Baker, R., Brick, J. M., Bates, N. A., Battaglia, M., Couper, M. P., Dever, J. A., Gile, K. J., & Tourangeau, R. (2013). Summary report of the AAPOR task force on non-probability sampling. Journal of Survey Statistics and Methodology, 1(2), 90–143. https://doi.org/10.1093/jssam/smt008
Biemer, P. P. (2010). Total survey error: Design, implementation, and evaluation. Public Opinion Quarterly, 74(5), 817–848. https://doi.org/10.1093/poq/nfq058
Blumberg, S. J., & Luke, J. V. (2007). Coverage bias in traditional telephone surveys of low-income and young adults. Public Opinion Quarterly, 71(5), 734–749. https://doi.org/10.1093/poq/nfm047
Couper, M. P. (2000). Web surveys: A review of issues and approaches. Public Opinion Quarterly, 64(4), 464–494. https://doi.org/10.1086/318641
Dillman, D. A., Smyth, J. D., & Christian, L. M. (2014). Internet, phone, mail, and mixed-mode surveys: The tailored design method (4th ed.). Wiley.
Eckman, S., & Kreuter, F. (2011). Confirmation bias in housing unit listing. Public Opinion Quarterly, 75(1), 139–150. https://doi.org/10.1093/poq/nfq066
Groves, R. M. (1989). Survey errors and survey costs. Wiley. https://doi.org/10.1002/0471725277
Groves, R. M., Fowler, F. J., Jr., Couper, M. P., Lepkowski, J. M., Singer, E., & Tourangeau, R. (2009). Survey methodology (2nd ed.). Wiley.
Hartley, H. O. (1962). Multiple frame surveys. In Proceedings of the Social Statistics Section (pp. 203–206). American Statistical Association.
Iannacchione, V. G. (2011). The changing role of address-based sampling in survey research. Public Opinion Quarterly, 75(3), 556–575. https://doi.org/10.1093/poq/nfr017
Kalton, G., & Flores-Cervantes, I. (2003). Weighting methods. Journal of Official Statistics, 19(2), 81–97.
Kish, L. (1965). Survey sampling. Wiley.
Lessler, J. T., & Kalsbeek, W. D. (1992). Nonsampling error in surveys. Wiley.
Link, M. W., Battaglia, M. P., Frankel, M. R., Osborn, L., & Mokdad, A. H. (2008). A comparison of address-based sampling (ABS) versus random-digit dialing (RDD) for general population surveys. Public Opinion Quarterly, 72(1), 6–27. https://doi.org/10.1093/poq/nfn003
Lohr, S. L., & Rao, J. N. K. (2000). Inference from dual frame surveys. Journal of the American Statistical Association, 95(449), 271–280. https://doi.org/10.1080/01621459.2000.10473920
Lohr, S. L. (2022). Sampling: Design and analysis (3rd ed.). CRC Press. https://doi.org/10.1201/9780429298899
Mohorko, A., de Leeuw, E., & Hox, J. (2013). Internet coverage and coverage bias in Europe: Developments across countries and over time. Journal of Official Statistics, 29(4), 609–622. https://doi.org/10.2478/jos-2013-0042
Tourangeau, R., Kreuter, F., & Eckman, S. (2012). Motivated underreporting in screening interviews. Public Opinion Quarterly, 76(3), 453–469. https://doi.org/10.1093/poq/nfs033
Valliant, R., Dever, J. A., & Kreuter, F. (2018). Practical tools for designing and weighting survey samples (2nd ed.). Springer. https://doi.org/10.1007/978-3-319-93632-1