
Surveys · Types and applications
Pulse Surveys: Frequent, Short Measurements in Fast-Moving Conditions
Pulse surveys ask a small number of questions at short intervals, often weekly or monthly, instead of a long survey once a year. This article explains why organisations use them, how to design them, the risks of fatigue and over-surveying, and how to turn frequent results into action.
For decades, the standard way to measure employee opinion was the annual survey: a long questionnaire, often of 60 to 100 questions, sent to all staff once a year, with results reported months later (Church & Waclawski, 2001; Kraut, 2006). Many organisations have found this model too slow. By the time results arrive, the situation they describe may have changed, and a year is a long time to wait to learn whether action has made a difference.
Pulse surveys are the response. A pulse survey asks a small number of questions, often between 3 and 15, at short intervals, such as weekly, fortnightly, monthly or quarterly. The aim is to give managers a continuous reading of how people feel, quick enough to act on (Welbourne, 2016). Pulse surveys are most common in employee research, but the same idea is used with customers, students and the public. During the COVID-19 pandemic, for example, the United States Census Bureau launched a Household Pulse Survey to measure the pandemic's effects on households every week or two (Fields et al., 2020).
This article explains how pulse surveys work, how they differ from annual surveys and how to use them well.
Pulse and annual surveys compared
Pulse and annual surveys serve different purposes and are often used together. The annual survey covers many topics in depth, provides a comprehensive baseline and allows detailed analysis of differences between groups. The pulse survey tracks a few key measures frequently, checks whether action is working and picks up emerging problems quickly.
| Annual survey | Pulse survey | |
|---|---|---|
| Length | 50 to 100 questions | 3 to 15 questions |
| Frequency | Once a year | Weekly to quarterly |
| Purpose | Comprehensive diagnosis | Tracking and early warning |
| Results | Weeks or months later | Days, often in real time |
| Sample | Usually everyone | Everyone or rotating samples |
Many organisations now combine a shorter annual or twice-yearly survey with pulses in between, an approach sometimes called continuous listening.
Designing a pulse survey
Choosing questions
Because a pulse survey contains so few questions, each must earn its place. Common choices include a measure of overall engagement or satisfaction, a question about workload or stress, a question about the topic of current concern, such as a reorganisation or a return to the office, and an open question asking what one thing would improve work.
Short surveys rely on short measures. Research shows that single-item measures of overall constructs, such as overall job satisfaction, can be reasonably valid. Wanous et al. (1997) found that a single question on overall job satisfaction correlated well with multi-item scales, and Fisher et al. (2016) set out when single items are acceptable: when the construct is narrow or clearly understood and the item is carefully worded. Short versions of established scales, such as the nine-item version of the Utrecht Work Engagement Scale (Schaufeli et al., 2006), offer a middle path between single items and full scales.
Core and rotating questions
A common design keeps a small core of questions asked in every pulse, so that trends can be tracked, and adds a few rotating questions on different topics each time. The rotating questions can follow up issues raised by earlier results, such as asking more about workload if workload scores have fallen.
Frequency
Frequency should match how quickly the things being measured can change and how quickly the organisation can respond. Weekly pulses can track rapidly changing situations, such as a crisis, but quickly tire respondents if nothing changes. Monthly or quarterly pulses suit most purposes. A useful rule is not to ask more often than the organisation can show it has acted on the results.
Sampling
Not every pulse needs to go to everyone. Some organisations send each pulse to a different random fraction of employees, so that each person is asked only a few times a year while the organisation still gets frequent readings. This reduces burden, but smaller samples mean larger margins of error, especially for small teams.
Delivery
Pulse surveys are usually delivered through software that sends invitations by email, through workplace messaging tools or as a prompt within systems employees already use. Mobile-friendly design matters, because many employees, particularly those who do not work at desks, answer on their phones. The survey should take no more than two or three minutes. Reminders should be limited, since repeated reminders for a short survey can irritate more than they help. Some organisations allow employees to answer at any time during a window of several days, which suits shift workers and people who travel.
Software also shapes how results are seen. Many platforms provide dashboards that update as answers arrive, with results broken down by team and compared with previous pulses. Dashboards make results easy to see, but they also make it easy to react to every small movement. Organisations should decide in advance who sees which results, at what level of detail and how quickly.
The risks: fatigue and nonresponse
The main risk of pulse surveys is survey fatigue. Being asked for feedback frequently can reduce willingness to respond, especially if respondents see no result from their answers. Porter et al. (2004) found that students who had been asked to complete several surveys were less likely to respond to later ones. Longer questionnaires also reduce participation and the quality of answers (Galesic & Bosnjak, 2009), which is one reason pulse surveys are kept short.
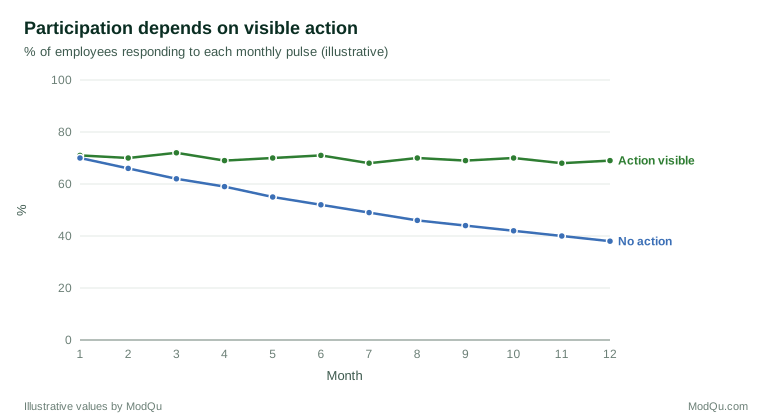
The perception that feedback leads nowhere is a powerful cause of nonresponse. Rogelberg et al. (2001) found that people's willingness to take part in surveys depended on whether they believed surveys were valuable, as well as on whether they enjoyed them. In organisations, employees who do not respond to surveys tend to be less satisfied and less committed, and they are more likely to believe their organisation will not act on the results (Rogelberg et al., 2000; Rogelberg & Stanton, 2007). Figure 1 illustrates the typical pattern: participation holds up when people see action and declines when they do not.
Turning results into action
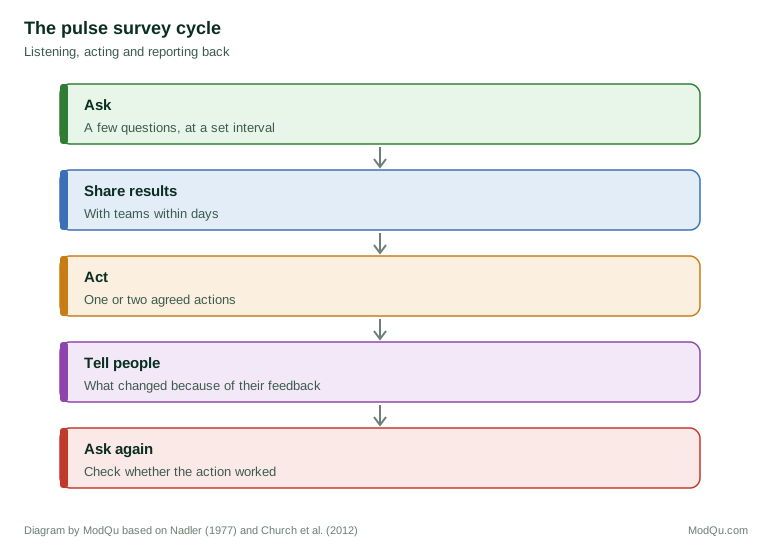
Surveys of any frequency improve things only if results lead to action. Research on survey feedback has long shown that sharing results with work groups and planning action together is what produces change (Nadler, 1977). Church et al. (2012) found that employees who reported that their managers had shared survey results and acted on them showed improvements in attitudes, while those whose managers did nothing showed no improvement or even decline.
Pulse surveys make this cycle faster, as Figure 2 shows. Results are available within days, managers can discuss them with their teams immediately, and the next pulse shows whether the action had any effect.
Practical steps include:
- Share results quickly with the teams that provided them, not only with senior leaders.
- Choose one or two actions rather than trying to address every issue.
- Tell people what changed as a result of their feedback, explicitly linking actions to survey results.
- Track the effect of actions in later pulses.
- Train managers to discuss results openly and to avoid defensiveness.
Analysing pulse data
Trends, not single readings
The value of a pulse survey lies in its trend. A single reading is subject to random variation, especially for small teams, and a fall of a few points from one month to the next may be noise. Analysts should look for sustained changes over several pulses and show confidence intervals or ranges on charts. Moving averages can smooth short-term variation.
Small groups and anonymity
Frequent reporting for small teams creates two problems. First, the margin of error for a team of eight people is very large, so differences between teams or months are often meaningless. Second, if results are reported for very small groups, individuals may be identifiable, especially when the same people answer every month. Most organisations set a minimum group size, often five to ten respondents, below which results are not shown (Borg & Mastrangelo, 2008). Frequent pulses can also allow individuals to be identified by comparing results from one period to the next, for example when one person joins or leaves a team.
Linking to outcomes
Engagement and satisfaction are of interest to organisations partly because they are related to outcomes. A large meta-analysis found that business units with higher employee engagement had better customer satisfaction, productivity and profitability and lower turnover (Harter et al., 2002), and job satisfaction is related to job performance (Saari & Judge, 2004). Engagement has also been linked to commitment and the intention to stay (Saks, 2006). Pulse data, collected frequently and linked to records such as staff turnover and absence, allow organisations to see whether changes in attitudes come before changes in outcomes.
Pulse surveys and diary research
Pulse surveys share features with research methods that measure experience repeatedly over short periods. Ecological momentary assessment and diary studies ask people about their experiences several times a day or every day (Shiffman et al., 2008). Research using weekly and daily surveys of employees has shown that engagement varies considerably from week to week and day to day within the same person, and that these variations are related to performance and recovery from work (Sonnentag, 2003; Bakker & Bal, 2010). This research suggests that a single annual measurement misses much of the variation in how people feel at work, which supports the case for more frequent measurement.
Beyond employees
The pulse approach is also used outside organisations. Customer experience programmes send short surveys after individual interactions. Universities use short surveys during a course rather than only at the end, so that teaching can be adjusted while students can still benefit. Governments and research organisations have used rapid pulse surveys to track public experiences during crises, trading some of the rigour of large surveys for speed (Fields et al., 2020).
Trust and ethics
Employees answer honestly only if they trust how their answers will be used. Organisations should state clearly whether a pulse survey is anonymous, with no link between answers and individuals, or confidential, where answers can be linked to records such as team and length of service but are reported only in groups. The two are often confused. If answers are linked to employee records, the organisation must protect that link and explain who can see it.
Frequent surveys also collect a continuous record of how people feel. That record must not be used to judge or monitor individuals, and managers should not try to work out who said what. Questions about wellbeing and mental health need particular care: organisations that ask about stress or burnout should be ready to respond with support, not only with statistics. Where employees are represented by unions or works councils, agreeing the purpose and rules of a pulse programme with them in advance builds trust and, in some countries, is required by law.
Common mistakes
- Asking too often for the organisation's ability to act.
- Asking without acting, which teaches people that feedback is ignored.
- Over-interpreting small changes, especially for small teams.
- Changing core questions frequently, which breaks trends.
- Reporting for groups so small that respondents can be identified.
- Using the pulse to monitor individuals, which destroys trust and honest answers.
An example
A company with 3,000 employees replaces its annual survey of 80 questions with a twice-yearly survey of 30 questions and monthly pulses of six questions. Each pulse includes four core questions and two rotating questions. In the first pulses, workload scores fall sharply in one division after a system change. The division's managers discuss the results with their teams, delay the next phase of the change and add temporary staff. Workload scores recover over the following three pulses, and participation in the division stays around 70 per cent, compared with a decline to below 50 per cent in an earlier year when annual survey results produced no visible action (illustrative example).
Conclusion
Pulse surveys trade depth for speed and frequency. Kept short, asked at a pace the organisation can respond to and followed by visible action, they give organisations a timely reading of how people feel and whether changes are working. Asked too often, or without action, they produce fatigue and falling participation. The pulse survey is a tool for continuous improvement only when it is part of a cycle of listening, acting and reporting back.
References
Bakker, A. B., & Bal, P. M. (2010). Weekly work engagement and performance: A study among starting teachers. Journal of Occupational and Organizational Psychology, 83(1), 189–206. https://doi.org/10.1348/096317909X402596
Borg, I., & Mastrangelo, P. M. (2008). Employee surveys in management: Theories, tools, and practical applications. Hogrefe.
Church, A. H., & Waclawski, J. (2001). Designing and using organizational surveys: A seven-step process. Jossey-Bass.
Church, A. H., Golay, L. M., Rotolo, C. T., Tuller, M. D., Shull, A. C., & Desrosiers, E. I. (2012). Without effort there can be no change: Reexamining the impact of survey feedback and action planning on employee attitudes. Research in Organizational Change and Development, 20, 223–264.
Fields, J. F., Hunter-Childs, J., Tersine, A., Sisson, J., Parker, E., Velkoff, V., Logan, C., & Shin, H. (2020). Design and operation of the 2020 Household Pulse Survey. U.S. Census Bureau.
Fisher, G. G., Matthews, R. A., & Gibbons, A. M. (2016). Developing and investigating the use of single-item measures in organizational research. Journal of Occupational Health Psychology, 21(1), 3–23. https://doi.org/10.1037/a0039139
Galesic, M., & Bosnjak, M. (2009). Effects of questionnaire length on participation and indicators of response quality in a web survey. Public Opinion Quarterly, 73(2), 349–360. https://doi.org/10.1093/poq/nfp031
Harter, J. K., Schmidt, F. L., & Hayes, T. L. (2002). Business-unit-level relationship between employee satisfaction, employee engagement, and business outcomes: A meta-analysis. Journal of Applied Psychology, 87(2), 268–279. https://doi.org/10.1037/0021-9010.87.2.268
Kraut, A. I. (Ed.). (2006). Getting action from organizational surveys: New concepts, technologies, and applications. Jossey-Bass.
Nadler, D. A. (1977). Feedback and organization development: Using data-based methods. Addison-Wesley.
Porter, S. R., Whitcomb, M. E., & Weitzer, W. H. (2004). Multiple surveys of students and survey fatigue. New Directions for Institutional Research, 2004(121), 63–73. https://doi.org/10.1002/ir.101
Rogelberg, S. G., & Stanton, J. M. (2007). Understanding and dealing with organizational survey nonresponse. Organizational Research Methods, 10(2), 195–209. https://doi.org/10.1177/1094428106294693
Rogelberg, S. G., Fisher, G. G., Maynard, D. C., Hakel, M. D., & Horvath, M. (2001). Attitudes toward surveys: Development of a measure and its relationship to respondent behavior. Organizational Research Methods, 4(1), 3–25. https://doi.org/10.1177/109442810141001
Rogelberg, S. G., Luong, A., Sederburg, M. E., & Cristol, D. S. (2000). Employee attitude surveys: Examining the attitudes of noncompliant employees. Journal of Applied Psychology, 85(2), 284–293. https://doi.org/10.1037/0021-9010.85.2.284
Saari, L. M., & Judge, T. A. (2004). Employee attitudes and job satisfaction. Human Resource Management, 43(4), 395–407. https://doi.org/10.1002/hrm.20032
Saks, A. M. (2006). Antecedents and consequences of employee engagement. Journal of Managerial Psychology, 21(7), 600–619. https://doi.org/10.1108/02683940610690169
Schaufeli, W. B., Bakker, A. B., & Salanova, M. (2006). The measurement of work engagement with a short questionnaire: A cross-national study. Educational and Psychological Measurement, 66(4), 701–716. https://doi.org/10.1177/0013164405282471
Shiffman, S., Stone, A. A., & Hufford, M. R. (2008). Ecological momentary assessment. Annual Review of Clinical Psychology, 4, 1–32. https://doi.org/10.1146/annurev.clinpsy.3.022806.091415
Sonnentag, S. (2003). Recovery, work engagement, and proactive behavior: A new look at the interface between nonwork and work. Journal of Applied Psychology, 88(3), 518–528. https://doi.org/10.1037/0021-9010.88.3.518
Wanous, J. P., Reichers, A. E., & Hudy, M. J. (1997). Overall job satisfaction: How good are single-item measures? Journal of Applied Psychology, 82(2), 247–252. https://doi.org/10.1037/0021-9010.82.2.247
Welbourne, T. M. (2016). The potential of pulse surveys: Transforming surveys into leadership tools. Employment Relations Today, 43(1), 33–39. https://doi.org/10.1002/ert.21548