
Surveys · Sampling
Probability Sampling Explained: Simple Random, Systematic, Stratified and Cluster
Probability sampling gives every member of a population a known, non-zero chance of selection, which allows results to be generalised with a measurable margin of error. This article explains the four basic designs, when each is used and how they are combined in practice.
Most surveys cannot ask everyone. A national survey of adults, a study of a company's customers or a poll of employees in a large organisation usually collects answers from a sample and uses them to draw conclusions about the whole population. Whether those conclusions can be trusted depends largely on how the sample was chosen.
A probability sample is one in which every member of the population has a known chance of selection that is greater than zero, and the selection is made by a random process. These two features allow statisticians to calculate how far the sample estimates are likely to be from the true population values, using the sampling distribution of the estimate, without making assumptions about who chose to take part (Kish, 1965; Lohr, 2022). This is the main difference from nonprobability samples, in which selection depends on availability, judgement or self-selection (Baker et al., 2013).
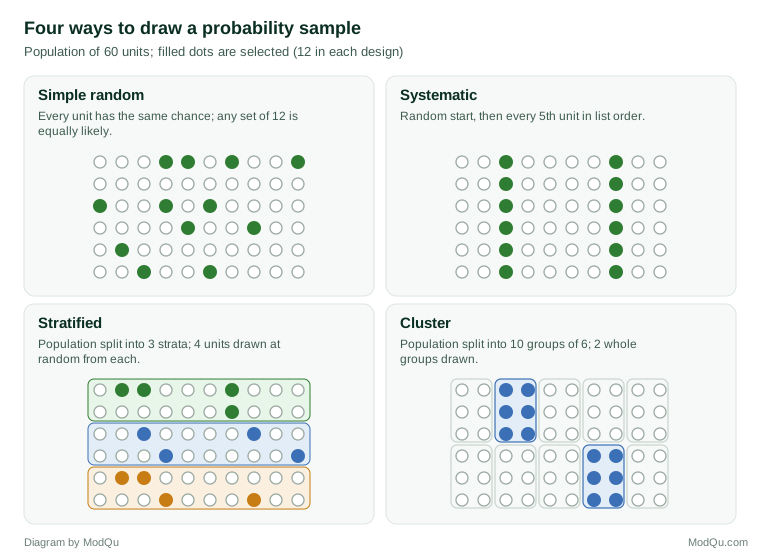
This article explains the four basic probability designs: simple random, systematic, stratified and cluster sampling. Figure 1 shows each one for the same small population.
Why randomness matters
The modern theory of probability sampling was set out by Neyman (1934), who showed that random selection, rather than purposive choice of "typical" units, allows the accuracy of estimates to be measured. Before then, statistical agencies often chose districts or households they judged to be representative. Neyman demonstrated that such judgement samples could be badly wrong and that there was no way to tell how wrong. With random selection, the uncertainty of an estimate can be expressed as a standard error and a margin of error. Over the following two decades, statisticians at the United States Census Bureau and elsewhere turned these ideas into practical methods for large surveys, which were brought together in one of the first comprehensive textbooks on the subject (Hansen et al., 1953). The theory that justifies inference from the selection probabilities alone, without a model of the population, is known as design-based inference (Smith, 1976).
Randomness also protects against hidden bias. When the researcher or the respondent chooses who is in the sample, the choice may be related to the very things being measured. A random process cannot be influenced in this way, so on average the sample resembles the population on all characteristics, including those the researcher did not think about (Cochran, 1977).
All probability designs need a sampling frame: a list or other means of identifying every unit in the population, such as a register of addresses, a customer database or a list of employees. If the frame leaves people out, the sample cannot represent them, whatever design is used (Groves et al., 2009).
Simple random sampling
In simple random sampling, every possible sample of a given size has the same chance of being chosen, so every unit has the same probability of selection. In practice, units on the frame are numbered and a random number generator picks the sample. Simple random sampling is the benchmark against which other designs are compared, and the standard formulas for margins of error found in textbooks assume it (Cochran, 1977).
Its advantages are simplicity and the absence of any assumptions about the structure of the population. Its disadvantages are practical. It needs a complete list, it can produce samples that by chance under-represent small groups, and for face-to-face surveys it scatters interviews across a wide area, which is expensive (Kalton, 1983).
Systematic sampling
In systematic sampling, the researcher calculates a sampling interval by dividing the population size by the sample size, picks a random starting point within the first interval and then takes every unit at that interval through the list. For a population of 10,000 and a sample of 500, the interval is 20; if the random start is 7, the sample consists of units 7, 27, 47 and so on.
Systematic sampling is easy to carry out, especially with physical lists or when sampling people as they pass a point, such as every twentieth customer leaving a shop. If the list is sorted by a relevant characteristic, such as region or size, the sample is automatically spread across that characteristic, which can make estimates more precise, an effect known as implicit stratification (Madow & Madow, 1944; Lohr, 2022).
The main risk is periodicity. If the list has a repeating pattern that matches the interval, the sample can be badly unbalanced. A list of flats in which every tenth flat is a corner unit, sampled with an interval of ten, could produce a sample of only corner flats. Checking the order of the list before sampling avoids this problem (Levy & Lemeshow, 2008).
Stratified sampling
In stratified sampling, the population is divided into groups called strata, such as regions, age groups or business sizes, and a separate random sample is drawn from each. Every stratum is represented by design, so chance cannot produce a sample that misses one.
Stratification has two main benefits. First, if the strata differ from each other on the survey variables, stratified samples give more precise estimates than simple random samples of the same size. Second, it allows the researcher to control the sample size in each group, which is useful when results are needed for small groups (Cochran, 1977).
The sample can be allocated to strata in proportion to their size, or disproportionately. Neyman (1934) showed that the most precise allocation for a fixed total sample gives more sample to strata that are larger and more variable. Disproportionate samples must be weighted in analysis, because units in different strata have different probabilities of selection (Kish, 1965; Valliant et al., 2018).
Cluster sampling
In cluster sampling, the population is divided into groups, called clusters, that are naturally close together, such as schools, villages, city blocks or company branches. A random sample of clusters is selected, and then either all units or a sample of units within the selected clusters are surveyed.
The main reason for clustering is cost. When interviewers must travel, or when no list of individuals exists but a list of clusters does, sampling clusters makes fieldwork feasible. A national survey might first select a sample of areas and then list and sample households only within those areas (Kish, 1965).
The price is precision. People in the same cluster tend to be similar, so each additional interview in a cluster adds less new information than an interview elsewhere would. This loss is measured by the design effect, the ratio of the variance under the actual design to the variance under a simple random sample of the same size (Kish, 1965). A design effect of 2 means the clustered sample of 1,000 gives the same precision as a simple random sample of 500, an effective sample size of 500 (illustrative figures). Design effects vary from question to question, and Kish (1995) recommended that they be calculated and reported for key estimates so that users can judge the real precision of a survey.
Combining designs
Real surveys usually combine these designs. A typical national household survey stratifies the country by region and type of area, selects clusters of areas within each stratum, often with probability proportional to their size, and then selects households systematically within the chosen areas (Lohr, 2022). This is called multistage sampling. Each stage uses one of the basic designs, and the overall probability of selection for each household is the product of the probabilities at each stage.
When units have unequal probabilities of selection, estimates must use weighting to correct for them. The general estimator for any probability design, proposed by Horvitz and Thompson (1952), weights each sampled unit by the inverse of its selection probability. A unit with a 1 in 100 chance of selection represents 100 units in the population. Selection with probability proportional to size, developed in the early years of survey sampling, relies on this principle (Hansen & Hurwitz, 1943; Brewer & Hanif, 1983).
Choosing a design
The choice of design depends on the population, the frame, the budget and the estimates required. Table 1 summarises the main considerations.
| Design | Best when | Main drawback |
|---|---|---|
| Simple random | A complete list exists and no structure is known | Can miss small groups by chance; spreads fieldwork |
| Systematic | Working from a list or a flow of people | Problems if the list has a repeating pattern |
| Stratified | Groups differ, or results are needed for each group | Needs information on every unit to form strata |
| Cluster | Units are spread out or only group lists exist | Less precise per interview |
In business surveys, stratification by customer segment, region or company size is especially common, because results are usually wanted for each segment. Cluster designs are used when, for example, a sample of stores is chosen first and customers are then sampled within each store.
An example
A software company with 40,000 business customers wants to measure satisfaction and compare small, medium and large customers. Large customers make up only 5 per cent of the list. A simple random sample of 1,000 would include about 50 large customers, too few for reliable results. The company therefore stratifies its customer list by size and draws 400 small, 300 medium and 300 large customers at random within each stratum. Within each stratum the list is sorted by region and selected systematically, so that regions are spread evenly. Because large customers are over-represented, each is given a smaller weight in the overall estimate, and each small customer a larger one, so that the combined result reflects the whole customer base (illustrative example).
Analysing data from complex samples
Data from stratified, clustered or weighted samples should not be analysed as if they came from a simple random sample. Ordinary statistical software that ignores the design will usually understate standard errors for clustered samples and can give biased estimates if weights are ignored. Specialised survey analysis procedures, available in most statistical packages, take the strata, clusters and weights into account (Lumley, 2010). Reports should describe the design and state how it was handled in analysis.
Common misunderstandings
A frequent misunderstanding is that a large sample is automatically a good one. A probability sample of 1,000 usually gives more reliable estimates than a self-selected sample of 100,000, because the size of a sample does not correct bias in how it was selected (Baker et al., 2013). Another is that random means haphazard. Approaching whoever happens to be nearby is not random sampling, because people do not have known chances of selection. A third is that probability sampling guarantees accuracy. It controls sampling error, but nonresponse and coverage gaps can still introduce bias, which is why high-quality surveys also work to achieve good response and accurate frames (Groves et al., 2009).
Conclusion
Probability sampling is the foundation of survey research that aims to describe populations with known accuracy. Simple random sampling provides the benchmark; systematic sampling makes selection practical; stratified sampling improves precision and guarantees coverage of key groups; and cluster sampling reduces fieldwork costs at some loss of precision. Most real surveys combine them in multistage designs, and their data must be analysed with methods that respect the design. Understanding these choices helps anyone who commissions or uses survey results to judge how far the findings can be trusted (Särndal et al., 1992; Thompson, 2012).
References
Baker, R., Brick, J. M., Bates, N. A., Battaglia, M., Couper, M. P., Dever, J. A., Gile, K. J., & Tourangeau, R. (2013). Summary report of the AAPOR task force on non-probability sampling. Journal of Survey Statistics and Methodology, 1(2), 90–143. https://doi.org/10.1093/jssam/smt008
Brewer, K. R. W., & Hanif, M. (1983). Sampling with unequal probabilities. Springer. https://doi.org/10.1007/978-1-4684-9407-5
Cochran, W. G. (1977). Sampling techniques (3rd ed.). Wiley.
Groves, R. M., Fowler, F. J., Jr., Couper, M. P., Lepkowski, J. M., Singer, E., & Tourangeau, R. (2009). Survey methodology (2nd ed.). Wiley.
Hansen, M. H., & Hurwitz, W. N. (1943). On the theory of sampling from finite populations. Annals of Mathematical Statistics, 14(4), 333–362. https://doi.org/10.1214/aoms/1177731356
Hansen, M. H., Hurwitz, W. N., & Madow, W. G. (1953). Sample survey methods and theory (Vols. 1–2). Wiley.
Horvitz, D. G., & Thompson, D. J. (1952). A generalization of sampling without replacement from a finite universe. Journal of the American Statistical Association, 47(260), 663–685. https://doi.org/10.1080/01621459.1952.10483446
Kalton, G. (1983). Introduction to survey sampling. SAGE. https://doi.org/10.4135/9781412984683
Kish, L. (1965). Survey sampling. Wiley.
Kish, L. (1995). Methods for design effects. Journal of Official Statistics, 11(1), 55–77.
Levy, P. S., & Lemeshow, S. (2008). Sampling of populations: Methods and applications (4th ed.). Wiley. https://doi.org/10.1002/9780470374597
Lohr, S. L. (2022). Sampling: Design and analysis (3rd ed.). CRC Press. https://doi.org/10.1201/9780429298899
Lumley, T. (2010). Complex surveys: A guide to analysis using R. Wiley. https://doi.org/10.1002/9780470580066
Madow, W. G., & Madow, L. H. (1944). On the theory of systematic sampling, I. Annals of Mathematical Statistics, 15(1), 1–24.
Neyman, J. (1934). On the two different aspects of the representative method: The method of stratified sampling and the method of purposive selection. Journal of the Royal Statistical Society, 97(4), 558–625. https://doi.org/10.2307/2342192
Smith, T. M. F. (1976). The foundations of survey sampling: A review. Journal of the Royal Statistical Society: Series A (General), 139(2), 183–204. https://doi.org/10.2307/2345174
Särndal, C.-E., Swensson, B., & Wretman, J. (1992). Model assisted survey sampling. Springer. https://doi.org/10.1007/978-1-4612-4378-6
Thompson, S. K. (2012). Sampling (3rd ed.). Wiley. https://doi.org/10.1002/9781118162934
Valliant, R., Dever, J. A., & Kreuter, F. (2018). Practical tools for designing and weighting survey samples (2nd ed.). Springer. https://doi.org/10.1007/978-3-319-93632-1