
Surveys · Sampling
Opt-In Online Samples: Can They Produce Valid Estimates?
Opt-in online samples are made up of people who volunteer to take surveys. They are fast and cheap, but because participants select themselves, their accuracy depends on assumptions. This article summarises what research shows about their accuracy and how to use them responsibly.
Most online surveys today are answered by people who chose to take part. They joined an online panel in return for small rewards, clicked on an invitation on a website or responded to an advertisement. These opt-in samples have transformed survey research by making data collection fast and inexpensive. But they raise a basic question: can a sample of volunteers produce valid estimates for a whole population?
Why self-selection is a problem
In a probability sample, the researcher decides who is selected, and each person's chance of selection is known. In an opt-in sample, people select themselves, and their chances of taking part are unknown. If the decision to take part is related to what the survey measures, estimates will be biased (Bethlehem, 2010). People who join survey panels tend to spend more time online, be more interested in expressing opinions and differ in other ways from the general population. These differences are not fully captured by age, sex and region (Baker et al., 2013).
A key point is that sample size does not cure self-selection bias. Meng (2018) showed that, when selection is related to the outcome, even an enormous self-selected sample can be less accurate than a small random one.
What the evidence shows
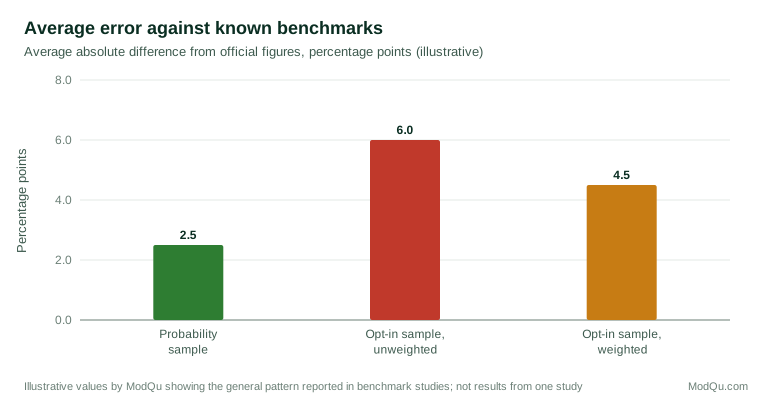
Researchers have tested opt-in samples by comparing their estimates with benchmarks from official statistics or high-quality government surveys. A large study in the United States found that probability samples, by telephone or online, were consistently more accurate than opt-in online samples, and that weighting improved the opt-in samples only partly (Yeager et al., 2011). A replication with newer data reached similar conclusions (MacInnis et al., 2018). A review of the evidence across countries found the same overall pattern, although some opt-in samples performed well on some measures (Cornesse et al., 2020).
Figure 1 illustrates the typical pattern. The values are illustrative, not taken from any one study.
The picture is not uniform. Opt-in samples vary widely between providers, so the accuracy of one cannot be assumed from another. A comparison with probability surveys that had very low response rates found that the gap between them was smaller than the earlier studies suggested, although probability samples still tended to perform better (Dutwin & Buskirk, 2017). Opt-in samples also tend to perform better for comparisons between groups and for relationships between variables than for estimates of levels, such as the percentage of people who do something (Baker et al., 2013).
Problems beyond selection
Self-selection is not the only concern. Because opt-in panels reward participation, some members take a very large number of surveys, and these "professional respondents" may answer differently from occasional participants. Some respondents rush through questionnaires to collect rewards, giving careless responding such as straightlining or random answers. Fraudulent accounts and automated programs also attempt to take surveys for payment. Panel providers use identity checks, attention checks and statistical screening to remove such cases, but their methods differ, and buyers should ask what checks are applied (Callegaro et al., 2014). These problems affect data quality regardless of how well the sample matches the population.
An example
A retailer wants to estimate the share of adults in its country who bought clothing online in the past month. An opt-in panel sample of 2,000 adults, with quotas on age, sex and region, gives an estimate of 48 per cent. The retailer's research team suspects that panel members shop online more than other adults, because they are recruited and surveyed online. They include two benchmark questions whose population values are known from an official survey: whether the respondent used the internet every day and whether they had bought anything online in the past year. The panel overstates both. After weighting on these variables as well as demographics, the clothing estimate falls to 41 per cent. The team reports the adjusted figure, notes that it may still be too high and recommends a probability-based check before using it to size the market (illustrative example).
Can adjustment fix the problem?
Statistical adjustment can reduce bias. Methods include weighting to population totals, matching the sample to a high-quality reference survey, propensity score adjustment and multilevel regression with post-stratification. These approaches treat survey inference like causal inference: they work when the variables that explain who takes part, and that are related to the outcome, are measured and used in the adjustment (Mercer et al., 2017; Elliott & Valliant, 2017). A well-known example produced accurate election forecasts from a highly unrepresentative sample of video game users after careful modelling (Wang et al., 2015).
The difficulty is knowing in advance whether the necessary variables are available. Adjustment that works well for one topic may fail for another.
Using opt-in samples responsibly
Opt-in samples are suitable for many purposes, such as testing questions, comparing versions of a product or advertisement, exploring attitudes and tracking change within the same panel. They are riskier when the aim is a precise population estimate that will drive an important decision. Good practice includes:
- Asking providers how their panels are recruited and maintained (Callegaro et al., 2014).
- Including benchmark questions with known population values to check accuracy.
- Weighting on variables related to both participation and the survey topic.
- Avoiding margins of error that assume random sampling.
- Describing the sample clearly in reports (Baker et al., 2013).
Conclusion
Opt-in online samples can produce useful estimates, and statistical adjustment can bring them closer to the truth. But their accuracy rests on assumptions about who takes part, not on the design of the sample. The evidence shows that they are, on average, less accurate than probability samples and more variable. They are a valuable tool when used for the right purposes and reported honestly.
References
Baker, R., Brick, J. M., Bates, N. A., Battaglia, M., Couper, M. P., Dever, J. A., Gile, K. J., & Tourangeau, R. (2013). Summary report of the AAPOR task force on non-probability sampling. Journal of Survey Statistics and Methodology, 1(2), 90–143. https://doi.org/10.1093/jssam/smt008
Bethlehem, J. (2010). Selection bias in web surveys. International Statistical Review, 78(2), 161–188. https://doi.org/10.1111/j.1751-5823.2010.00112.x
Callegaro, M., Baker, R., Bethlehem, J., Göritz, A. S., Krosnick, J. A., & Lavrakas, P. J. (Eds.). (2014). Online panel research: A data quality perspective. Wiley. https://doi.org/10.1002/9781118763520
Cornesse, C., Blom, A. G., Dutwin, D., Krosnick, J. A., De Leeuw, E. D., Legleye, S., Pasek, J., Pennay, D., Phillips, B., Sakshaug, J. W., Struminskaya, B., & Wenz, A. (2020). A review of conceptual approaches and empirical evidence on probability and nonprobability sample survey research. Journal of Survey Statistics and Methodology, 8(1), 4–36. https://doi.org/10.1093/jssam/smz041
Dutwin, D., & Buskirk, T. D. (2017). Apples to oranges or gala versus golden delicious? Comparing data quality of nonprobability internet samples to low response rate probability samples. Public Opinion Quarterly, 81(S1), 213–239. https://doi.org/10.1093/poq/nfw061
Elliott, M. R., & Valliant, R. (2017). Inference for nonprobability samples. Statistical Science, 32(2), 249–264. https://doi.org/10.1214/16-STS598
MacInnis, B., Krosnick, J. A., Ho, A. S., & Cho, M.-J. (2018). The accuracy of measurements with probability and nonprobability survey samples: Replication and extension. Public Opinion Quarterly, 82(4), 707–744. https://doi.org/10.1093/poq/nfy038
Meng, X.-L. (2018). Statistical paradises and paradoxes in big data (I): Law of large populations, big data paradox, and the 2016 US presidential election. The Annals of Applied Statistics, 12(2), 685–726. https://doi.org/10.1214/18-AOAS1161SF
Mercer, A. W., Kreuter, F., Keeter, S., & Stuart, E. A. (2017). Theory and practice in nonprobability surveys: Parallels between causal inference and survey inference. Public Opinion Quarterly, 81(S1), 250–271. https://doi.org/10.1093/poq/nfw060
Wang, W., Rothschild, D., Goel, S., & Gelman, A. (2015). Forecasting elections with non-representative polls. International Journal of Forecasting, 31(3), 980–991. https://doi.org/10.1016/j.ijforecast.2014.06.001
Yeager, D. S., Krosnick, J. A., Chang, L., Javitz, H. S., Levendusky, M. S., Simpser, A., & Wang, R. (2011). Comparing the accuracy of RDD telephone surveys and internet surveys conducted with probability and non-probability samples. Public Opinion Quarterly, 75(4), 709–747. https://doi.org/10.1093/poq/nfr020