
Surveys · Questionnaire design
Open-Ended Versus Closed-Ended Questions: Trade-offs in Data Quality
Open questions let respondents answer in their own words; closed questions ask them to choose from a list. This article reviews the evidence on how each format affects what is measured, who answers and what the results can be used for, and sets out practical rules for choosing between them.
Every survey question takes one of two basic forms. An open-ended question asks respondents to answer in their own words: "What is the main reason you chose this supplier?" A closed-ended question offers a set of answers to choose from: "Which of the following was the main reason you chose this supplier? Price; quality; delivery time; recommendation; other." The two versions look as if they ask the same thing. In practice they often produce different answers, different patterns of missing data and different conclusions.
The choice between the formats is one of the oldest debates in survey research. In the 1940s, researchers argued about whether "depth" interviews with open questions or "polls" with fixed choices gave a truer picture of public opinion, and Paul Lazarsfeld proposed a compromise that is still useful: use each format for the job it does best (Lazarsfeld, 1944). This article explains what each format measures, reviews the classic and more recent evidence, and offers practical guidance for deciding which to use.
What each format asks of respondents
Answering any survey question involves understanding it, recalling relevant information, forming a judgement and then reporting that judgement in the form the question requires (Tourangeau et al., 2000). The two formats differ mainly in the last two steps.
With an open question, respondents must generate their own answer. They decide what counts as relevant, how much to say and how to phrase it. This places more demand on memory and on writing or speaking, but it leaves the respondent free to say what matters to them.
With a closed question, the answer options do much of this work. They remind respondents of possibilities they might not have recalled, define the range of acceptable answers and tell respondents what kind of answer the researcher has in mind. Respondents treat the options as information about what the question means (Schwarz, 1999). This makes closed questions easier and quicker, but it also means the options shape the answers.
Neither of these is a flaw in itself. They are different measurement tools, and each is accurate for some purposes and misleading for others.
The classic evidence
Lists suggest answers
The best-known experiments on question form were carried out by Howard Schuman and Stanley Presser, who randomly assigned respondents in national surveys to open or closed versions of the same question (Schuman & Presser, 1979, 1981). In one series, people were asked what they valued most in a job. The closed version offered five qualities, such as high income, chances for advancement and work that gives a feeling of accomplishment. The open version simply asked the question.
The results differed in two ways. First, the closed list shaped the distribution of answers: options on the list were chosen far more often than the same ideas were mentioned spontaneously. Second, many open answers did not fit any of the closed categories at all. When the researchers revised the closed list to reflect the most common open answers, the two forms came much closer together. The lesson was not that one format is right and the other wrong, but that a closed question is only as good as its list of options.
A later experiment made the same point about public issues. Asked in open form what they considered the most important problem facing the country, very few Americans mentioned any of four issues that the researchers then offered on a closed list. In the closed form, a clear majority chose one of the four, even though respondents were explicitly invited to name a different problem (Schuman & Scott, 1987). Offering an issue on a list made it seem important. An "other, please specify" option did not correct the effect, because respondents rarely use it when a list appears to cover the topic.
Open questions are not neutral either
It would be wrong to conclude that open questions simply reveal what people "really" think. Open answers are shaped by what comes to mind at the moment of asking, by how articulate and motivated the respondent is and by how the question is worded. Respondents who give short or vague answers may hold the same views as those who write at length but simply express them less fully.
This raised a concern that open questions measure verbal ability rather than opinion. John Geer examined the issue directly and found that the number of comments people gave to open questions mainly reflected how many concerns they had about the topic, not their education or articulateness (Geer, 1988). In a later study he showed that open questions do capture the issues that are most salient to respondents (Geer, 1991). Open questions are therefore a reasonable guide to what people spontaneously think about, which is a different thing from what they would agree with if asked.
Data quality trade-offs
Range and depth
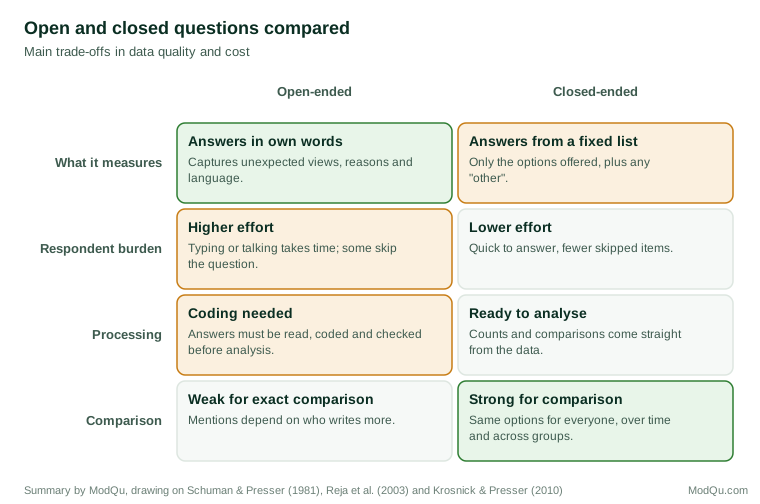
The main strength of open questions is that they capture answers the researcher did not anticipate. Reja and colleagues compared open and closed versions of questions in a web survey about the internet and found that the open version produced a more diverse set of answers, including many that the closed list did not include. The closed version, in turn, produced answers that respondents might not have offered spontaneously (Reja et al., 2003). Open questions also record reasons, examples and the language respondents use, which are valuable for writing better closed questions and for explaining the numbers to decision makers.
Missing data and effort
The main weakness of open questions is that many people do not answer them, or answer briefly. Open questions take more time and effort, and in self-administered surveys there is no interviewer to encourage a fuller response. Item nonresponse to open questions is consistently higher than to closed questions (Reja et al., 2003). Because the people who skip open questions or write very little may differ from those who write a great deal, open answers can over-represent the views of the most engaged respondents.
Effort matters for closed questions too, but in a different way. When respondents are tired or unmotivated, they may pick the first reasonable option, agree with statements or choose the same point on a scale for every item, a set of behaviours known as satisficing (Krosnick, 1991). Closed questions make satisficing easy because a plausible answer is always available. Open questions make it more visible: a respondent who types "fine" or "n/a" has clearly not engaged.
Response options as a frame of reference
Closed questions about behaviour are affected by the range of the response options as well as their content. In a well-known experiment, respondents asked how many hours a day they watched television reported more viewing when the response scale ran up to "more than four and a half hours" than when it started at "up to half an hour" and topped out at "more than two and a half hours" (Schwarz et al., 1985). Respondents used the scale as a guide to what normal viewing looked like and placed themselves accordingly. An open question ("How many hours do you watch on a typical day?") avoids this frame-of-reference effect, though it may produce more rounded answers.
This is one reason that experts often recommend open questions for numeric quantities such as age, number of visits or amounts spent, where the answer is a number the respondent can report directly (Bradburn et al., 2004). The design of the answer field still matters. Studies of web surveys show that the size of the input box, labels and examples of the expected format affect whether people enter well-formed answers (Couper et al., 2011).
Coding, reliability and cost
Open answers must be turned into data before they can be analysed. Traditionally this means developing a coding frame (a list of categories with definitions and examples), training coders and having them assign each answer to one or more categories. The process is slow and costly, and it introduces a new source of error: different coders may classify the same answer differently. Reliability is usually checked by having two coders classify a sample of answers independently and computing an agreement statistic that corrects for chance agreement, such as Cohen's kappa (Cohen, 1960). Content analysis texts set out the procedures in detail (Krippendorff, 2018).
Computer-assisted methods have reduced the cost. Statistical text models can identify themes in thousands of open answers and relate them to respondents' other characteristics (Roberts et al., 2014), and newer language models can propose and apply codes at scale. These tools still need human checking against a sample, because they can misread irony, mixed answers and specialist language.
Closed questions, by contrast, produce data that are ready to analyse. This is a large practical advantage in big surveys and in studies that repeat the same questions over time.
Comparability
Closed questions give every respondent the same options, which makes comparisons between groups and over time straightforward. Open questions are harder to compare, because the proportion mentioning a topic depends on how much people write, how they are probed and how the answers are coded. A small change in coding rules between two waves can create an apparent trend that is really a change in method. When tracking change is the main goal, closed questions are usually safer.
Design matters for open questions
The quality of open answers depends heavily on how the question is presented, especially in web surveys. Smyth and colleagues found that larger answer boxes and a short instruction encouraging respondents to give detail led to longer and more informative answers (Smyth et al., 2009). Box size can also affect whether people answer at all, so the box should fit the length of answer expected rather than simply being as large as possible (Zuell et al., 2015).
Follow-up probes can help. In an interviewer survey, a trained interviewer can ask "Anything else?" or "Can you tell me more about that?" In web surveys, an automatic follow-up prompt shown after a short answer has been found to increase the amount of information given, particularly among respondents interested in the topic (Holland & Christian, 2009).
The device used to answer matters as well. Typing on a smartphone is slower and more awkward than on a computer keyboard, and comparisons of narrative open questions have found shorter answers on smartphones (Revilla & Ochoa, 2016). Surveys that expect many mobile respondents should use open questions sparingly and keep the expected answers short, or offer voice input where the platform allows it.
Finally, open questions are more useful when they come with a clear purpose. "Any other comments?" at the end of a questionnaire tends to collect a mixture of complaints and thanks. A focused question, such as "What is one thing we could change that would make you more likely to renew?", produces answers that can be coded and acted on. Responses to such questions, and other verbatim material collected during a survey, can also be used to check how respondents interpreted the closed questions and to diagnose problems with them (Singer & Couper, 2017).
Choosing between the formats
The evidence points to a set of practical rules.
Use open questions when:
- The range of possible answers is unknown, as in early-stage research on a new product, market or issue.
- The aim is to learn what is spontaneously on people's minds, not what they would agree with when reminded.
- The researcher needs reasons, examples or the respondent's own language.
- The answer is a simple number or a short fact, such as age, a count or an amount.
- The number of respondents is small enough to read and code the answers properly.
Use closed questions when:
- The main answers are known, for example from earlier research or pilot work.
- Results must be compared across groups, regions or time periods.
- The sample is large and fast, low-cost analysis is required.
- Respondent burden must be kept low, for example in short mobile surveys.
- The concept has a recognised measurement standard that should be followed.
Combine the two when both breadth and comparability matter. A common approach is a closed question followed by an open follow-up for selected answers ("You said you were dissatisfied. What was the main reason?"). This keeps the main measure comparable while recording reasons and catching new issues.
Building closed questions from open answers
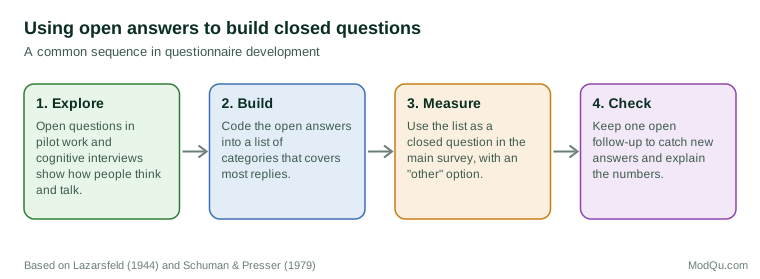
Lazarsfeld's 1944 compromise remains the best advice: use open questions to discover the possibilities, then closed questions to measure how common they are (Lazarsfeld, 1944; Converse & Presser, 1986). In practice this means asking open questions in pilot interviews or a small first survey, coding the answers and using the most frequent categories as the options of a closed question in the main study. Schuman and Presser's experiments showed why this works: closed lists built from open answers agree far more closely with open results than lists written from the researcher's assumptions (Schuman & Presser, 1979).
Several further points make closed lists more accurate:
- Cover the main answers. If a large share of respondents choose "other," the list is missing something important.
- Keep categories distinct. Options should not overlap, so that each answer fits in one place.
- Order options carefully. In self-administered surveys, options near the top of a list tend to be chosen more often; in spoken interviews, the last options heard are favoured. Randomising order for unordered lists spreads this effect evenly (Krosnick & Presser, 2010).
- Allow "other, please specify" but do not rely on it. Respondents seldom write in new answers when a list looks complete (Schuman & Scott, 1987).
- Revisit the list. Markets and opinions change. An open follow-up question asked periodically shows when the list is out of date.
Implications for business research
For businesses, the choice of format often determines what a survey can be used for. A closed question on reasons for cancelling a subscription can show that "price" is the most common reason and track whether that share changes after a price increase. It cannot reveal a reason the company has not thought of, such as confusion about how to pause a subscription. An open question can reveal it, but the company will struggle to say exactly how common it is unless the answers are carefully coded.
A practical illustration: suppose a software company asks a closed question about the main reason for not renewing and finds that 40% choose "too expensive," 25% "missing features" and 10% "other" (illustrative numbers). An open follow-up shows that many of those choosing "too expensive" are in fact comparing the product with a free tool already provided by their employer. The closed question gave a measurable headline; the open answers changed the interpretation. The combination is worth more than either format alone.
Many experienced researchers therefore recommend that every substantial survey include at least one well-designed open question, even if most of the questionnaire is closed (Dillman et al., 2014). It costs little, it captures what the closed questions missed and it provides the quotations that bring a report to life.
Conclusion
Open and closed questions are not competing answers to the same problem. They measure different things. Closed questions measure how many people choose among options the researcher has defined, which makes them efficient, comparable and easy to analyse, but they also suggest answers and miss what the researcher did not foresee. Open questions measure what people think of spontaneously and in their own words, which makes them rich and revealing, but they are more burdensome, more often skipped and more expensive to process. Good questionnaire design uses each format for what it does well, builds closed lists from open answers and keeps an open question in reserve to catch what the list leaves out (Fowler, 1995; Payne, 1951).
References
Bradburn, N. M., Sudman, S., & Wansink, B. (2004). Asking questions: The definitive guide to questionnaire design for market research, political polls, and social and health questionnaires (Rev. ed.). Jossey-Bass.
Cohen, J. (1960). A coefficient of agreement for nominal scales. Educational and Psychological Measurement, 20(1), 37–46. https://doi.org/10.1177/001316446002000104
Converse, J. M., & Presser, S. (1986). Survey questions: Handcrafting the standardized questionnaire. SAGE. https://doi.org/10.4135/9781412986045
Couper, M. P., Kennedy, C., Conrad, F. G., & Tourangeau, R. (2011). Designing input fields for non-narrative open-ended responses in web surveys. Journal of Official Statistics, 27(1), 65–85.
Dillman, D. A., Smyth, J. D., & Christian, L. M. (2014). Internet, phone, mail, and mixed-mode surveys: The tailored design method (4th ed.). Wiley.
Fowler, F. J., Jr. (1995). Improving survey questions: Design and evaluation. SAGE.
Geer, J. G. (1988). What do open-ended questions measure? Public Opinion Quarterly, 52(3), 365–371. https://doi.org/10.1086/269113
Geer, J. G. (1991). Do open-ended questions measure "salient" issues? Public Opinion Quarterly, 55(3), 360–370. https://doi.org/10.1086/269268
Holland, J. L., & Christian, L. M. (2009). The influence of topic interest and interactive probing on responses to open-ended questions in web surveys. Social Science Computer Review, 27(2), 196–212. https://doi.org/10.1177/0894439308327481
Krippendorff, K. (2018). Content analysis: An introduction to its methodology (4th ed.). SAGE.
Krosnick, J. A., & Presser, S. (2010). Question and questionnaire design. In P. V. Marsden & J. D. Wright (Eds.), Handbook of survey research (2nd ed., pp. 263–313). Emerald.
Krosnick, J. A. (1991). Response strategies for coping with the cognitive demands of attitude measures in surveys. Applied Cognitive Psychology, 5(3), 213–236. https://doi.org/10.1002/acp.2350050305
Lazarsfeld, P. F. (1944). The controversy over detailed interviews: An offer for negotiation. Public Opinion Quarterly, 8(1), 38–60. https://doi.org/10.1086/265666
Payne, S. L. (1951). The art of asking questions. Princeton University Press.
Reja, U., Manfreda, K. L., Hlebec, V., & Vehovar, V. (2003). Open-ended vs. close-ended questions in web questionnaires. Developments in Applied Statistics (Metodološki zvezki), 19, 159–177.
Revilla, M., & Ochoa, C. (2016). Open narrative questions in PC and smartphones: Is the device playing a role? Quality & Quantity, 50(6), 2495–2513. https://doi.org/10.1007/s11135-015-0273-2
Roberts, M. E., Stewart, B. M., Tingley, D., Lucas, C., Leder-Luis, J., Gadarian, S. K., Albertson, B., & Rand, D. G. (2014). Structural topic models for open-ended survey responses. American Journal of Political Science, 58(4), 1064–1082. https://doi.org/10.1111/ajps.12103
Schuman, H., & Presser, S. (1979). The open and closed question. American Sociological Review, 44(5), 692–712. https://doi.org/10.2307/2094521
Schuman, H., & Presser, S. (1981). Questions and answers in attitude surveys: Experiments on question form, wording, and context. Academic Press.
Schuman, H., & Scott, J. (1987). Problems in the use of survey questions to measure public opinion. Science, 236(4804), 957–959. https://doi.org/10.1126/science.236.4804.957
Schwarz, N. (1999). Self-reports: How the questions shape the answers. American Psychologist, 54(2), 93–105. https://doi.org/10.1037/0003-066X.54.2.93
Schwarz, N., Hippler, H.-J., Deutsch, B., & Strack, F. (1985). Response scales: Effects of category range on reported behavior and comparative judgments. Public Opinion Quarterly, 49(3), 388–395. https://doi.org/10.1086/268936
Singer, E., & Couper, M. P. (2017). Some methodological uses of responses to open questions and other verbatim comments in quantitative surveys. Methods, Data, Analyses, 11(2), 115–134. https://doi.org/10.12758/mda.2017.01
Smyth, J. D., Dillman, D. A., Christian, L. M., & McBride, M. (2009). Open-ended questions in web surveys: Can increasing the size of answer boxes and providing extra verbal instructions improve response quality? Public Opinion Quarterly, 73(2), 325–337. https://doi.org/10.1093/poq/nfp029
Tourangeau, R., Rips, L. J., & Rasinski, K. (2000). The psychology of survey response. Cambridge University Press. https://doi.org/10.1017/CBO9780511819322
Zuell, C., Menold, N., & Körber, S. (2015). The influence of the answer box size on item nonresponse to open-ended questions in a web survey. Social Science Computer Review, 33(1), 115–122. https://doi.org/10.1177/0894439314528091