
Surveys · Questionnaire design
Writing Survey Questions That Measure What You Intend to Measure
Every survey question is a measuring instrument for an idea that cannot be observed directly. This article explains how to move from a concept to questions that capture it, how validity and reliability are assessed, and the practical steps that keep measurement on target.
A survey question is a measuring instrument. When a company asks customers how likely they are to recommend it, it is trying to measure loyalty. When an employer asks staff whether they would like to be working at the organisation in two years' time, it is trying to measure commitment. Neither loyalty nor commitment can be observed directly. Each has to be translated into questions, and the answers to those questions are only as useful as the translation is faithful.
This translation is where many surveys quietly go wrong. Questions are often written to sound reasonable rather than to measure a clearly defined concept, and their results are then interpreted as though they measured exactly what the report says. This article explains the logic of measurement in surveys: how to move from a concept to questions, how to judge whether questions measure what they are meant to measure, and what practical steps make good measurement more likely.
From concept to question
Measurement starts with a construct: the idea a researcher wants to capture, such as satisfaction, trust, brand awareness, financial stress or job security. The process of turning a construct into something that can be measured is called operationalisation. It usually involves three steps.
First, the construct is defined. What exactly does "customer loyalty" mean for this study? Is it an attitude (feeling attached to a brand), an intention (planning to buy again) or a behaviour (actually buying again)? Each is a legitimate construct, but they are different, and they need different questions.
Second, the construct is broken into dimensions if it has more than one aspect. Job satisfaction, for example, is often treated as including satisfaction with pay, colleagues, supervision, the work itself and opportunities for advancement.
Third, each dimension is captured by one or more indicators: specific questions whose answers are expected to reflect it. The answers to these questions, combined in some way, become the measurement of the construct.
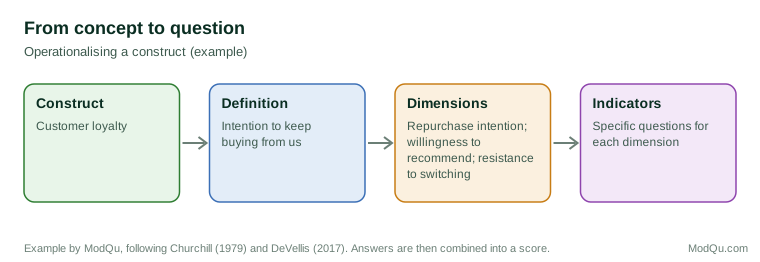
Churchill (1979) set out an influential version of this process for marketing research, starting from a clear specification of the domain of the construct and moving through item generation, data collection, purification of the items and assessment of reliability and validity. Rossiter (2002) later argued that the most important step is the first one: a precise definition of the object being rated, the attribute being measured and the person doing the rating. If the construct is defined vaguely, no amount of statistical refinement afterwards will make the questions measure it well.
Validity: are we measuring the right thing?
A measure is valid to the extent that it captures the construct it is intended to capture. Validity is not a single property that a question either has or lacks. It is a judgement, built from several kinds of evidence, about how well the scores support the interpretations made from them (Messick, 1995).
Content validity asks whether the questions cover the full scope of the construct and nothing else. A measure of job satisfaction that asked only about pay would miss most of the construct; one that included questions about commuting distance might drift outside it. Content validity is established mainly by careful definition and expert review.
Construct validity asks whether the scores behave as the theory of the construct predicts. Cronbach and Meehl (1955) described how construct validity is built by testing predictions: if a measure of customer loyalty is valid, it should correlate with related measures such as satisfaction, and with later behaviour such as repurchase. Campbell and Fiske (1959) added that a valid measure should correlate more strongly with other measures of the same construct than with measures of different constructs that use the same method. Their multitrait-multimethod design remains a standard way to separate what a question measures from how it measures it.
Criterion validity asks whether scores agree with an external standard. For factual questions, the standard may be a record. Studies that compared survey reports of voting with official turnout records have found that substantial numbers of people who did not vote say that they did, partly because voting is socially desirable and partly because of memory confusion (Belli et al., 1999; Ansolabehere & Hersh, 2012). Such validation studies show that even simple factual questions can be biased.
Reliability: are we measuring consistently?
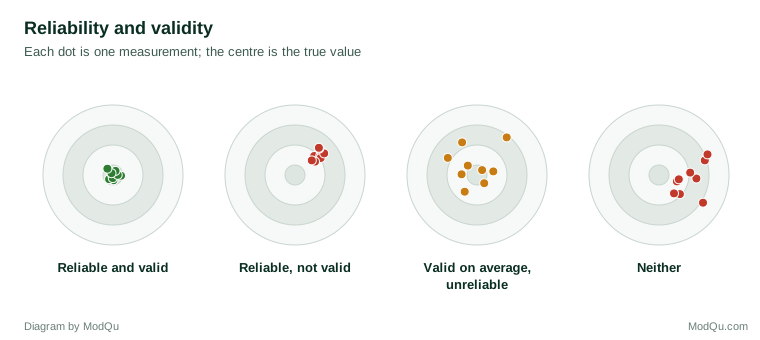
A measure is reliable to the extent that it gives consistent results when the thing being measured has not changed. A bathroom scale that shows a different weight each time you step on it is unreliable, even if its average is correct.
Reliability can be assessed in several ways. Test-retest reliability compares answers from the same people at two points in time. Internal consistency checks whether several questions intended to measure the same construct produce similar answers; the most widely used statistic is Cronbach's alpha (Cronbach, 1951). In large surveys, reliability can also be estimated from panel data in which the same questions are repeated, a method Alwin (2007) used to estimate the reliability of hundreds of survey questions. His analyses showed that reliability varies systematically with features of the question: factual questions are usually more reliable than attitudes, and questions with clearly labelled response options tend to be more reliable than those with unlabelled scales.
Reliability and validity are related but distinct. A reliable measure can still be invalid if it consistently measures the wrong thing. An unreliable measure, however, cannot be highly valid, because random noise limits how strongly it can correlate with anything.
Measurement error in practice
Survey methodologists often describe each answer as the true value plus error. The error has a random part, which reduces reliability, and a systematic part, which introduces bias. Both come from the question-answering process. Respondents may interpret the question differently from the researcher, retrieve incomplete or inaccurate memories, form judgements influenced by context, or edit their answers to look good (Tourangeau et al., 2000).
Saris and Gallhofer (2014) used a large set of multitrait-multimethod experiments to estimate how much specific design choices affect measurement quality. Features such as the number of scale points, whether all points are labelled, whether a "don't know" option is offered and whether the question uses an agree-disagree format were all associated with differences in quality. Their work shows that measurement quality is not fixed by the topic. It can be raised or lowered by choices that the questionnaire designer controls.
Economists have documented similar issues for factual data. Bound et al. (2001) reviewed studies comparing survey reports of earnings, hours, benefits and other economic variables with administrative records and found that errors were common and often correlated with the true values, which can bias the results of statistical analyses in ways that are hard to predict.
Facts, behaviours and attitudes need different questions
The kind of construct shapes the kind of question. Questions about facts, such as age, job title or the number of employees in a firm, have a true answer that could in principle be checked. The main risks are misunderstanding of terms and lack of knowledge, especially when one person answers for a household or an organisation.
Questions about behaviour, such as how often a customer contacts support or how many hours an employee works, also have true answers, but they depend on memory. People rarely count such events; they estimate, often by recalling a typical week and multiplying, or by relying on a general impression. Estimates are better when the reference period is short and specific, when the behaviour is distinctive, and when questions provide cues that help retrieval (Tourangeau et al., 2000; Bradburn et al., 2004). For frequent, mundane behaviours, a short recent period ("in the past seven days") usually gives more accurate answers than a long one.
Questions about attitudes and evaluations, such as satisfaction or trust, have no external true value. Their answers are constructed at the moment of asking from whatever considerations come to mind, which makes them especially sensitive to wording, context and format. For these constructs, validity rests on careful definition, tested items and evidence that scores relate to other measures and later behaviour in the expected way.
Single questions or multiple items?
A common design decision is whether to measure a construct with one question or several. Multiple-item scales have traditionally been preferred in academic research because combining items averages out some of the random error in each, increasing reliability, and because several items can cover more of a construct's content (Nunnally & Bernstein, 1994; DeVellis, 2017).
Single items have their defenders. Bergkvist and Rossiter (2007) compared single-item and multiple-item measures of attitude towards an advertisement and towards a brand and found no difference in predictive validity. They argued that when a construct is concrete and singular, a well-written single question can be as good as a scale and imposes less burden. For abstract constructs with several dimensions, multiple items remain the safer choice.
In practice, the decision should depend on the construct. A concrete question, such as whether a respondent has heard of a brand, needs only one item. An abstract and multifaceted construct, such as organisational commitment, is better served by a tested multi-item scale.
Reflective and formative measures
A less obvious design decision concerns the direction of the relationship between a construct and its indicators. In most scales the construct is assumed to cause the answers: a person's underlying satisfaction drives how they answer several satisfaction questions, so the items should be strongly correlated and any one of them could be dropped without changing the meaning of the measure. These are called reflective indicators.
Some constructs work the other way. A measure of socio-economic status built from income, education and occupation, or a measure of "ease of doing business" built from the effort involved in ordering, invoicing and support, is formed by its indicators. The items need not be correlated with one another, since a customer may find ordering easy and invoicing hard, and dropping an item changes what the measure means. Diamantopoulos and Winklhofer (2001) showed that treating formative indicators as if they were reflective, for example by discarding items that do not correlate with the rest, can remove essential parts of the construct. Deciding which model applies is therefore part of defining the construct, not a technical detail to be settled after the data are in.
Common method variance
When all the measures in a study come from the same respondents, in the same questionnaire, using the same response format, part of the correlation between them may reflect the shared method rather than any real relationship. A respondent in a good mood may rate everything a little higher; a respondent who tends to agree with statements will agree with all of them. This common method variance can inflate the apparent relationship between, say, employee engagement and perceived leadership quality.
Podsakoff et al. (2003) reviewed the sources of the problem and the remedies. Design remedies include obtaining the predictor and outcome from different sources (for example, linking survey ratings to sales records), separating related questions within the questionnaire, varying response formats and assuring respondents of anonymity so that they feel less pressure to answer consistently. Statistical remedies can estimate and partly adjust for the method effect, but none is as effective as avoiding the problem at the design stage.
Measuring the same thing in different groups
Many surveys compare groups: customers in different countries, employees in different departments, men and women, younger and older respondents. Such comparisons assume that the questions measure the same construct in the same way in every group. If a translated item carries a different nuance, or if one group interprets a response scale differently, an apparent difference between groups may be an artefact of measurement.
Researchers test this assumption, known as measurement invariance, by checking whether the relationships between items and the construct are the same across groups before comparing scores. Vandenberg and Lance (2000) set out a widely used sequence of tests, from whether the same items relate to the construct in each group, to whether they do so with equal strength, to whether a given level of the construct produces the same average answers. Only when the stricter forms of invariance hold can group averages be compared with confidence. Business surveys that compare results across countries or languages are especially exposed to this issue, and translation and cognitive testing in each language are the first line of defence.
Practical steps for measuring what you intend
The research points to a set of practical steps that apply to any survey, commercial or academic.
1. Write down the construct before writing any questions. State in a sentence or two what the study is trying to measure and why. If the people commissioning the survey disagree about the definition, resolve that disagreement first.
2. Distinguish attitudes, intentions and behaviours. Questions about what people think, what they plan to do and what they have done measure different things. Reports of past behaviour are usually more predictive of future behaviour than stated intentions, but are subject to memory errors (Groves et al., 2009).
3. Use established measures where they exist. Validated scales for many constructs, from life satisfaction to brand attitude, have been tested extensively. Using them saves effort and allows comparison with other studies, provided they fit the construct and population.
4. Make each question concrete and unambiguous. Specify time periods, define terms that respondents might read differently and ask about one thing at a time (Fowler, 1992; Bradburn et al., 2004).
5. Choose response formats deliberately. Labelled scales, balanced options and item-specific rather than agree-disagree formats generally improve measurement quality (Saris & Gallhofer, 2014).
6. Reduce pressure to give desirable answers. For sensitive topics, use self-administered modes and wording that makes every answer acceptable (Tourangeau & Yan, 2007; Kreuter et al., 2008).
7. Test the questions before fielding them. Cognitive interviews reveal how respondents actually understand each question and how they arrive at their answers (Willis, 2005). Pilot tests show whether the questionnaire works as a whole. Presser et al. (2004) review the range of pretesting methods and their strengths.
8. Check the results for signs of validity. After fielding, examine whether scores relate to other variables in the expected way, whether multi-item scales are internally consistent, and whether factual answers match known benchmarks.
An example: measuring "ease of doing business"
Suppose a business-to-business supplier wants to measure how easy customers find it to work with the company. A first draft might ask, "How easy is it to do business with us?" on a five-point scale. The question is short and clear, but what does "do business" cover? Ordering, invoicing, getting technical support, resolving complaints and negotiating contracts may each be easy or difficult, and different respondents may think of different activities.
A better approach starts by defining the construct: the effort a customer must spend to complete routine interactions with the supplier. Interviews with a few customers then identify the main interactions. The questionnaire asks about the effort involved in each, using item-specific wording ("How much effort did it take to place your most recent order?"), and adds one overall question. Analysis checks whether the specific items hang together, whether the overall score relates to renewal intentions and later renewal, and which interactions contribute most. The result is a measure that the company can interpret and act on, rather than a single number whose meaning is unclear.
Conclusion
Measuring what you intend to measure is the central challenge of questionnaire design. It requires a clear definition of the construct, a careful translation into concrete questions, and evidence that the answers are both consistent and meaningful. The research reviewed here shows that measurement quality is not a matter of chance: it depends on design decisions about wording, format, mode and the number of items, and it can be checked with established methods. Investing in that work at the start of a survey is the most reliable way to ensure that its numbers mean what the report says they mean.
References
Alwin, D. F. (2007). Margins of error: A study of reliability in survey measurement. Wiley. https://doi.org/10.1002/9780470146316
Ansolabehere, S., & Hersh, E. (2012). Validation: What big data reveal about survey misreporting and the real electorate. Political Analysis, 20(4), 437–459. https://doi.org/10.1093/pan/mps023
Belli, R. F., Traugott, M. W., Young, M., & McGonagle, K. A. (1999). Reducing vote overreporting in surveys: Social desirability, memory failure, and source monitoring. Public Opinion Quarterly, 63(1), 90–108. https://doi.org/10.1086/297704
Bergkvist, L., & Rossiter, J. R. (2007). The predictive validity of multiple-item versus single-item measures of the same constructs. Journal of Marketing Research, 44(2), 175–184. https://doi.org/10.1509/jmkr.44.2.175
Bound, J., Brown, C., & Mathiowetz, N. (2001). Measurement error in survey data. In J. J. Heckman & E. Leamer (Eds.), Handbook of econometrics (Vol. 5, pp. 3705–3843). Elsevier. https://doi.org/10.1016/S1573-4412(01)05012-7
Bradburn, N. M., Sudman, S., & Wansink, B. (2004). Asking questions: The definitive guide to questionnaire design for market research, political polls, and social and health questionnaires (Rev. ed.). Jossey-Bass.
Campbell, D. T., & Fiske, D. W. (1959). Convergent and discriminant validation by the multitrait-multimethod matrix. Psychological Bulletin, 56(2), 81–105. https://doi.org/10.1037/h0046016
Churchill, G. A., Jr. (1979). A paradigm for developing better measures of marketing constructs. Journal of Marketing Research, 16(1), 64–73. https://doi.org/10.1177/002224377901600110
Cronbach, L. J., & Meehl, P. E. (1955). Construct validity in psychological tests. Psychological Bulletin, 52(4), 281–302. https://doi.org/10.1037/h0040957
Cronbach, L. J. (1951). Coefficient alpha and the internal structure of tests. Psychometrika, 16(3), 297–334. https://doi.org/10.1007/BF02310555
DeVellis, R. F. (2017). Scale development: Theory and applications (4th ed.). SAGE.
Diamantopoulos, A., & Winklhofer, H. M. (2001). Index construction with formative indicators: An alternative to scale development. Journal of Marketing Research, 38(2), 269–277. https://doi.org/10.1509/jmkr.38.2.269.18845
Fowler, F. J., Jr. (1992). How unclear terms affect survey data. Public Opinion Quarterly, 56(2), 218–231. https://doi.org/10.1086/269312
Groves, R. M., Fowler, F. J., Jr., Couper, M. P., Lepkowski, J. M., Singer, E., & Tourangeau, R. (2009). Survey methodology (2nd ed.). Wiley.
Kreuter, F., Presser, S., & Tourangeau, R. (2008). Social desirability bias in CATI, IVR, and web surveys: The effects of mode and question sensitivity. Public Opinion Quarterly, 72(5), 847–865. https://doi.org/10.1093/poq/nfn063
Messick, S. (1995). Validity of psychological assessment: Validation of inferences from persons' responses and performances as scientific inquiry into score meaning. American Psychologist, 50(9), 741–749. https://doi.org/10.1037/0003-066X.50.9.741
Nunnally, J. C., & Bernstein, I. H. (1994). Psychometric theory (3rd ed.). McGraw-Hill.
Podsakoff, P. M., MacKenzie, S. B., Lee, J.-Y., & Podsakoff, N. P. (2003). Common method biases in behavioral research: A critical review of the literature and recommended remedies. Journal of Applied Psychology, 88(5), 879–903. https://doi.org/10.1037/0021-9010.88.5.879
Presser, S., Couper, M. P., Lessler, J. T., Martin, E., Martin, J., Rothgeb, J. M., & Singer, E. (2004). Methods for testing and evaluating survey questions. Public Opinion Quarterly, 68(1), 109–130. https://doi.org/10.1093/poq/nfh008
Rossiter, J. R. (2002). The C-OAR-SE procedure for scale development in marketing. International Journal of Research in Marketing, 19(4), 305–335. https://doi.org/10.1016/S0167-8116(02)00097-6
Saris, W. E., & Gallhofer, I. N. (2014). Design, evaluation, and analysis of questionnaires for survey research (2nd ed.). Wiley. https://doi.org/10.1002/9781118634646
Tourangeau, R., & Yan, T. (2007). Sensitive questions in surveys. Psychological Bulletin, 133(5), 859–883. https://doi.org/10.1037/0033-2909.133.5.859
Tourangeau, R., Rips, L. J., & Rasinski, K. (2000). The psychology of survey response. Cambridge University Press. https://doi.org/10.1017/CBO9780511819322
Vandenberg, R. J., & Lance, C. E. (2000). A review and synthesis of the measurement invariance literature: Suggestions, practices, and recommendations for organizational research. Organizational Research Methods, 3(1), 4–70. https://doi.org/10.1177/109442810031002
Willis, G. B. (2005). Cognitive interviewing: A tool for improving questionnaire design. SAGE. https://doi.org/10.4135/9781412983655