
Surveys · Sampling
Non-Probability Sampling: Convenience, Quota, Snowball and Purposive Methods
Non-probability samples are chosen without a random process that gives every population member a known chance of selection. This article explains the four main methods, what each is good for, and how their results can be made more trustworthy.
Not every survey uses a random sample. Many studies, from market research panels to qualitative interviews, select people in other ways: because they are easy to reach, because they fit a quota, because someone referred them or because the researcher chose them for a reason. These are non-probability samples. Because the chance that any given person is selected is unknown, the statistical theory that supports probability samples does not apply directly, and results cannot be generalised to a population with a known margin of error (Baker et al., 2013).
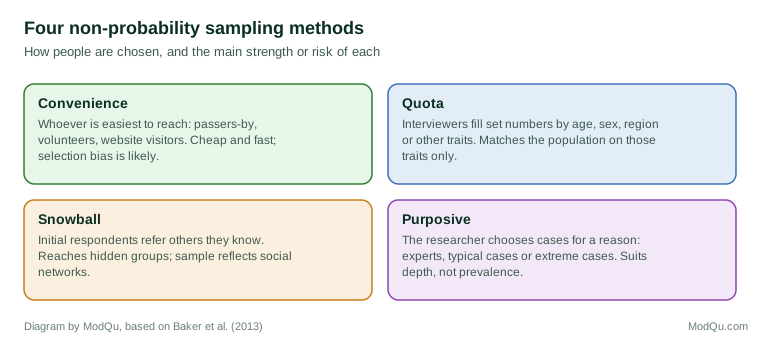
That does not make non-probability samples useless. They are often cheaper, faster and sometimes the only option. The question is what they can and cannot support. This article describes the four classic methods, shown in Figure 1, and what is known about their accuracy.
Convenience sampling
A convenience sample consists of people who are easy to reach: students in a lecture, shoppers in a mall, visitors to a website or volunteers who answer an open invitation. It is the cheapest and fastest method, which is why it is so common in pilot studies, classroom research and early product testing (Etikan et al., 2016).
The weakness is selection bias. The people who are easiest to reach usually differ from the rest of the population in ways that matter. Visitors to a website are more interested in its subject than people who never visit it; volunteers for a health survey are often healthier and better educated than average. Larger convenience samples do not solve this problem, because size does not correct a biased selection process (Baker et al., 2013).
Quota sampling
In quota sampling, the researcher sets targets for the number of respondents with particular characteristics, such as age, sex and region, usually in proportion to their share of the population. Interviewers or online systems then recruit people until each quota is full.
Quota sampling became the standard method of commercial and political polling in the mid-twentieth century. Its results match the population on the quota variables, which makes it look representative. Within each quota cell, however, selection is still by convenience. An experimental comparison of quota and random sampling in Britain found that quota samples could produce reasonable estimates for some variables but showed biases that their margins of error did not reflect (Moser & Stuart, 1953). Quota samples are as good as the assumption that, within each cell, the people recruited are similar to those who were not.
Snowball sampling
In snowball sampling, the researcher starts with a few members of the target group and asks them to recruit or name others, who in turn name others. The method was formalised as a statistical technique by Goodman (1961) and is widely used to reach groups for which no list exists, such as people who use drugs, members of informal networks or specialists in a narrow field (Biernacki & Waldorf, 1981).
Its strength is reach. Its weakness is that the sample reflects the social networks of the initial contacts, so people who are well connected are over-represented and isolated people may never be reached. Respondent-driven sampling was developed to address this, by tracking who recruited whom and using network information to weight the results (Heckathorn, 1997).
Purposive sampling
In purposive sampling, the researcher selects cases deliberately because they are informative for the research question: experts with specialist knowledge, typical cases, extreme cases or cases that differ in theoretically important ways. Purposive sampling is standard in qualitative research, where the goal is understanding rather than estimating how common something is (Patton, 2015; Palinkas et al., 2015).
It should not be used to estimate population figures. A purposive sample of ten industry experts can explain why a market is changing; it cannot say what share of firms hold a given view.
How accurate are non-probability samples?
Large comparisons of survey results with known benchmarks, such as government records, have generally found that probability samples are more accurate than non-probability online samples, and that the accuracy of non-probability samples varies more from one provider to another (Yeager et al., 2011; Cornesse et al., 2020). Non-probability samples are not always wrong, but it is harder to know in advance when they will be right.
Statistical adjustment can improve them. Weighting to match population totals, matching samples to a reference survey and modelling approaches such as MRP can reduce bias when the variables that drive selection are measured and included (Elliott & Valliant, 2017; Mercer et al., 2017). A well-known demonstration produced accurate election forecasts from a highly unrepresentative sample of video game users by modelling and adjusting the data (Wang et al., 2015). Adjustment works only to the extent that the reasons people end up in the sample are captured by the variables used.
In business research
Most commercial survey research today relies on non-probability samples, especially online panels whose members have signed up to take surveys in exchange for small rewards. Panel companies usually apply quotas on age, sex and region, so their samples combine convenience recruitment with quota control (Baker et al., 2013). For many business purposes, such as testing which of two advertisements people prefer or exploring reactions to a new product, this is adequate, because the comparison between versions matters more than an exact population figure. The risk is greatest when businesses use such samples to estimate the size of a market or the share of people with a given behaviour, because these figures depend directly on how representative the sample is.
An example
A company wants to know what share of small business owners in its region plan to buy new accounting software in the next year. It has three options. It could survey owners who visit its website, a convenience sample that would overstate interest because visitors are already looking at software. It could buy an online panel sample with quotas on business size and industry, which would be balanced on those traits but might over-represent owners who like taking surveys. Or it could draw a random sample from a business register, which would be slower and more expensive but would support a measurable margin of error. If the company only needs to compare reactions to two product designs, the panel sample may be good enough. If it needs a market size for an investment decision, the register sample is the safer choice (illustrative example).
When to use each method
Non-probability methods are appropriate when the goal is exploration, testing or understanding, rather than precise population estimates; when no frame exists; or when time and budget rule out probability sampling. In these situations, researchers should choose the method that best fits the purpose: purposive selection for depth, snowball recruitment for hidden groups, quotas for broad balance and convenience samples for quick tests.
Good practice
- State clearly how the sample was obtained and what population it is meant to represent.
- Avoid reporting margins of error that assume a probability sample; if a measure of precision is given, explain how it was calculated (Baker et al., 2013).
- Collect variables that may explain selection, so that results can be adjusted.
- Compare key results with reliable external benchmarks where possible.
- Treat findings as indicative and look for consistency across sources.
Conclusion
Non-probability sampling covers a wide range of practices, from quick convenience samples to carefully designed quota and network methods. Each has legitimate uses, and modern adjustment methods can make their estimates more accurate. But the absence of known selection probabilities means their accuracy rests on assumptions rather than design. Being clear about which method was used, and why, is the first step to using their results responsibly (Cornesse et al., 2020).
References
Baker, R., Brick, J. M., Bates, N. A., Battaglia, M., Couper, M. P., Dever, J. A., Gile, K. J., & Tourangeau, R. (2013). Summary report of the AAPOR task force on non-probability sampling. Journal of Survey Statistics and Methodology, 1(2), 90–143. https://doi.org/10.1093/jssam/smt008
Biernacki, P., & Waldorf, D. (1981). Snowball sampling: Problems and techniques of chain referral sampling. Sociological Methods & Research, 10(2), 141–163. https://doi.org/10.1177/004912418101000205
Cornesse, C., Blom, A. G., Dutwin, D., Krosnick, J. A., De Leeuw, E. D., Legleye, S., Pasek, J., Pennay, D., Phillips, B., Sakshaug, J. W., Struminskaya, B., & Wenz, A. (2020). A review of conceptual approaches and empirical evidence on probability and nonprobability sample survey research. Journal of Survey Statistics and Methodology, 8(1), 4–36. https://doi.org/10.1093/jssam/smz041
Elliott, M. R., & Valliant, R. (2017). Inference for nonprobability samples. Statistical Science, 32(2), 249–264. https://doi.org/10.1214/16-STS598
Etikan, I., Musa, S. A., & Alkassim, R. S. (2016). Comparison of convenience sampling and purposive sampling. American Journal of Theoretical and Applied Statistics, 5(1), 1–4. https://doi.org/10.11648/j.ajtas.20160501.11
Goodman, L. A. (1961). Snowball sampling. Annals of Mathematical Statistics, 32(1), 148–170. https://doi.org/10.1214/aoms/1177705148
Heckathorn, D. D. (1997). Respondent-driven sampling: A new approach to the study of hidden populations. Social Problems, 44(2), 174–199. https://doi.org/10.2307/3096941
Mercer, A. W., Kreuter, F., Keeter, S., & Stuart, E. A. (2017). Theory and practice in nonprobability surveys: Parallels between causal inference and survey inference. Public Opinion Quarterly, 81(S1), 250–271. https://doi.org/10.1093/poq/nfw060
Moser, C. A., & Stuart, A. (1953). An experimental study of quota sampling. Journal of the Royal Statistical Society: Series A (General), 116(4), 349–405. https://doi.org/10.2307/2343021
Palinkas, L. A., Horwitz, S. M., Green, C. A., Wisdom, J. P., Duan, N., & Hoagwood, K. (2015). Purposeful sampling for qualitative data collection and analysis in mixed method implementation research. Administration and Policy in Mental Health and Mental Health Services Research, 42(5), 533–544. https://doi.org/10.1007/s10488-013-0528-y
Patton, M. Q. (2015). Qualitative research and evaluation methods (4th ed.). SAGE.
Wang, W., Rothschild, D., Goel, S., & Gelman, A. (2015). Forecasting elections with non-representative polls. International Journal of Forecasting, 31(3), 980–991. https://doi.org/10.1016/j.ijforecast.2014.06.001
Yeager, D. S., Krosnick, J. A., Chang, L., Javitz, H. S., Levendusky, M. S., Simpser, A., & Wang, R. (2011). Comparing the accuracy of RDD telephone surveys and internet surveys conducted with probability and non-probability samples. Public Opinion Quarterly, 75(4), 709–747. https://doi.org/10.1093/poq/nfr020