
Surveys · Types and applications
Net Promoter Score: Origins, Evidence and Criticisms
The Net Promoter Score is one of the most widely used customer metrics in business. This article explains where it came from, how it is calculated, what research shows about its ability to predict growth and the main criticisms of how it is measured and used.
Few survey measures have spread as quickly as the Net Promoter Score (NPS). Introduced in a 2003 article in the Harvard Business Review, it is now used by a large share of major companies, reported to boards and investors and used to set targets and bonuses. Its appeal lies in its simplicity: one question, one number. Its critics argue that the simplicity comes at a cost in information and precision, and that the original claims for its predictive power have not been confirmed. This article explains the origins of NPS, reviews the evidence and sets out how to use it well.
Origins
Frederick Reichheld, a consultant who had studied customer loyalty, argued that companies were measuring satisfaction with long, complicated surveys that did not predict growth. In "The one number you need to grow", he reported that a single question, "How likely is it that you would recommend [company] to a friend or colleague?", correlated more strongly with company growth than other questions he had tested in several industries (Reichheld, 2003). He proposed the Net Promoter Score as a simple measure of loyalty and later developed it into a management system (Reichheld, 2006).
The proposal arrived at a time when many managers were frustrated with long satisfaction reports that were hard to act on. A single number that could be explained in a sentence, compared across units and tracked monthly was attractive. Software vendors built NPS into customer feedback platforms, consultancies offered benchmarks and the score began to appear in annual reports and investor presentations. Its spread owed more to its ease of use and communication than to published evidence, which at first consisted mainly of the original analyses by its developers.
Calculation
Customers answer the recommendation question on a scale from 0 ("not at all likely") to 10 ("extremely likely"). They are grouped as:
- Promoters: 9 or 10.
- Passives: 7 or 8.
- Detractors: 0 to 6.
The NPS is the percentage of promoters minus the percentage of detractors. It can range from −100, if every customer is a detractor, to +100, if every customer is a promoter. Passives count towards the total but not towards either group.
The idea behind the grouping is that promoters actively recommend the company and drive growth, while detractors spread negative word of mouth. Research supports the general link between satisfaction, recommendation and word of mouth: Anderson (1998) found that both very satisfied and very dissatisfied customers spread word of mouth, the dissatisfied somewhat more.
Evidence on prediction
The central claim for NPS was that it predicts company growth better than other measures. Independent research has not confirmed this claim.
Keiningham, Cooil, Andreassen and Aksoy (2007) tried to replicate Reichheld's findings using data from Norway and found that NPS did not predict revenue growth better than the American Customer Satisfaction Index; in several industries, neither measure predicted growth well. Keiningham, Cooil, Aksoy, Andreassen and Weiner (2007) compared metrics at the level of individual customers and found that recommendation intention was no better than satisfaction or other loyalty measures at predicting retention, recommendation and share of spending. Morgan and Rego (2006) analysed several satisfaction and loyalty measures and found that recommendation-based measures, including a version of NPS, predicted business performance less well than average satisfaction or the proportion of satisfied customers.
Later studies found a more mixed picture. de Haan et al. (2015) compared customer feedback metrics for predicting customer retention and found that NPS performed reasonably well, alongside satisfaction measures, while no single metric was best in all industries. Baehre et al. (2022) found that NPS was related to sales growth in some settings, supporting a modest predictive role. Overall, the evidence suggests that NPS is a reasonable measure of customer loyalty, comparable to satisfaction measures, but not uniquely powerful.
Criticisms of the measure
Critics have identified several problems with NPS as a measurement.
Loss of information. Converting an 11-point scale into three groups and then into a single difference discards information. A customer who moves from 0 to 6 does not change the score; one who moves from 8 to 9 does. Changes in the score may therefore not reflect changes in customer views (Grisaffe, 2007; Kristensen & Eskildsen, 2014).
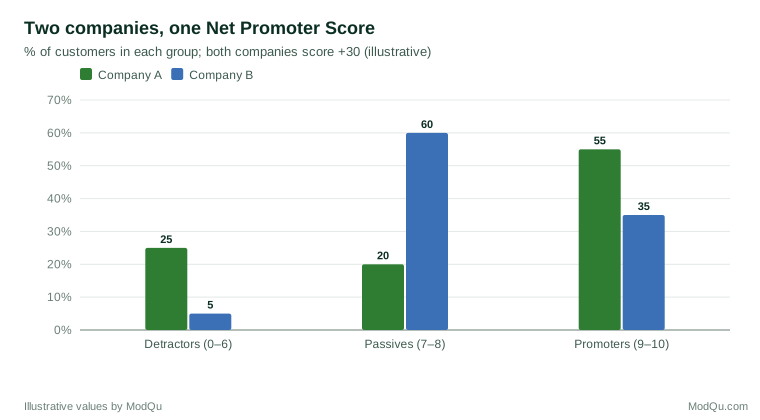
Same score, different customers. Very different distributions can produce the same NPS. A company with many promoters and many detractors can have the same score as one with few of either and many passives. Figure 1 shows an example. The two companies face very different situations, but the single number hides the difference (Keiningham et al., 2008).
Arbitrary cut-offs. The thresholds of 9 and 6 were chosen from analyses in the United States. Response styles differ between countries and cultures: in some, respondents rarely use the extreme points of a scale (Baumgartner & Steenkamp, 2001). A 9 may mean something different in Japan than in the United States, so comparisons of NPS between countries can mislead.
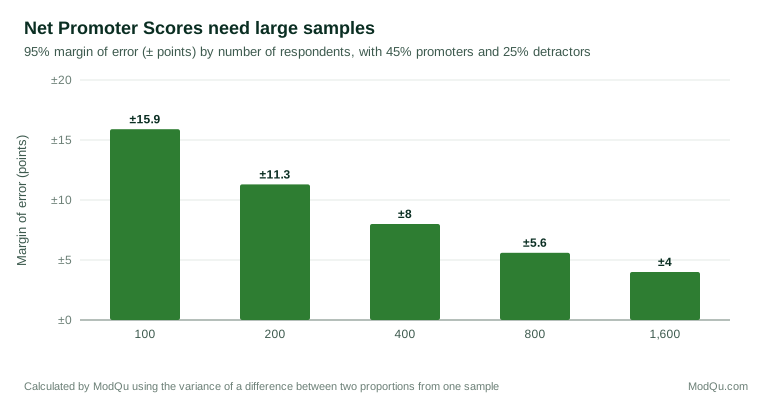
Imprecision. Because NPS is the difference between two proportions, its sampling error is larger than that of either proportion alone. With 400 respondents, the margin of error is around eight points. Figure 2 shows how the margin of error falls with sample size.
Many organisations report NPS for small groups, such as a single store or a single month, where changes of 10 or 20 points can occur by chance alone. Treating such changes as real can lead to poor decisions and unfair judgements of staff.
Intention, not behaviour. NPS measures stated likelihood of recommending, not actual recommendation. East et al. (2011) noted that many customers who say they are likely to recommend never do, and that the measure excludes negative word of mouth from customers who are not detractors. Raassens and Haans (2017) found that promoter scores were related to online word of mouth, but that the relationship was not straightforward.
Single question. A single item is less reliable than a multi-item scale, and it cannot explain why customers feel as they do (Pingitore et al., 2007). Reichheld (2006) recommended a follow-up open question asking the reason for the score, which addresses part of this concern.
The scale itself
The NPS question uses an 11-point scale with labels only at the ends. Research on rating scales suggests that scales with more points can be somewhat more reliable than very short ones, though gains level off beyond about seven to ten points (Preston & Colman, 2000). Scales labelled only at the end points leave respondents to interpret the meaning of each number for themselves, which increases differences between people in how they use the scale (Krosnick & Fabrigar, 1997). The numbers shown also affect answers: Schwarz et al. (1991) found that the same verbal labels attached to different numeric ranges, such as 0 to 10 compared with −5 to +5, changed the distribution of responses. Organisations that change the scale, for example by showing it vertically on smartphones, starting it at 1 instead of 0 or colouring the numbers, may change their scores without any change in customer views.
Relationship and transactional NPS
Organisations use NPS in two ways. Relationship NPS asks a sample of customers about the company as a whole, typically once or twice a year. Transactional NPS asks customers immediately after a particular interaction, such as a purchase or a call to customer service. The two measure different things. Transactional scores reflect the most recent experience and are useful for managing service processes; relationship scores reflect the cumulative evaluation that is more closely linked to loyalty (Anderson et al., 1994). Mixing the two in a single reported score, or comparing one with the other, confuses interpretation.
Comparison with satisfaction indices
Satisfaction indices such as the American Customer Satisfaction Index use several questions combined in a statistical model, which makes them more reliable and allows them to show what drives satisfaction (Fornell et al., 1996). NPS sacrifices this depth for simplicity. Where research has compared the two directly, they have usually performed similarly in predicting company outcomes (Keiningham, Cooil, Andreassen, & Aksoy, 2007). The choice between them is therefore less about predictive power than about purpose: a single question suits frequent tracking and communication, while a multi-item index suits diagnosis and benchmarking.
Testing whether a change is real
Because NPS is noisy, organisations should test whether a change is larger than would be expected by chance. The variance of the score can be calculated from the shares of promoters and detractors, and from it a confidence interval for the score or for the difference between two periods. Alternatively, the average rating on the 0 to 10 scale can be tracked; it uses all the information in the answers and has a smaller margin of error relative to its range. Control charts, which show the range of normal variation over time, help managers distinguish real shifts from random movement.
Employee Net Promoter Score
The same question has been adapted for employees: "How likely is it that you would recommend this organisation as a place to work?" The employee NPS is popular because it is short and easy to compare. It shares the same measurement problems as the customer version and adds others: employees may fear that answers are not anonymous, and response is often low in the groups most likely to be dissatisfied. It is best treated as one item within a broader engagement survey.
Criticisms of use
Many problems arise from how NPS is used rather than from the question itself.
Gaming. When managers or front-line staff are rewarded for high NPS, they may ask customers for high scores, choose which customers are surveyed or discourage unhappy customers from responding. These practices inflate the score without improving the customer experience.
Self-selection. Many NPS surveys are sent after every transaction and rely on customers who choose to answer. Respondents may be unrepresentative of customers as a whole.
Mode and wording. Small changes to the question or to the mode of the survey change scores. Telephone surveys typically produce more positive ratings than self-administered ones (Ye et al., 2011). Comparisons with competitors or "industry benchmarks" collected in other ways can be misleading.
Overreliance. Fisher and Kordupleski (2019) criticised the use of NPS as a single measure of customer value, arguing that it gives management little guidance on what to change and can distract from more informative research.
Using NPS well
Despite these criticisms, NPS can be useful if it is treated as one indicator among several and measured carefully:
- Report the distribution, not only the score: show the percentages of promoters, passives and detractors, or the average rating.
- Show the margin of error, and avoid reporting results for small groups.
- Use random samples rather than relying on self-selected feedback.
- Keep wording and mode constant over time.
- Ask why, with an open question and questions about specific aspects of the experience.
- Link to behaviour, by checking whether promoters and detractors actually differ in retention, spending and referrals.
- Avoid tying individual bonuses to small-sample scores.
- Use other measures too, such as satisfaction and customer effort, which may predict outcomes as well or better in some settings (Morgan & Rego, 2006; de Haan et al., 2015).
An example
A software company reports its NPS monthly to its board. The score rises from +18 to +31 in one month and the board congratulates the product team. An analyst notes that the monthly sample is only about 150 customers, so the margin of error is around 13 points, and that a new survey tool started sending invitations only to customers who had used the product in the past week. Using a random monthly sample of 800 customers drawn from all active accounts, the score is +22 with a margin of error of about six points, and quarterly changes become more stable. The company adds average satisfaction and a question about ease of use to its dashboard (illustrative example).
Conclusion
The Net Promoter Score succeeded because it is simple, intuitive and easy to communicate. Independent research shows that it is a reasonable measure of customer loyalty but not a uniquely powerful predictor of growth, and that its design discards information and amplifies sampling error. Many of its problems arise from small samples, self-selection and incentives to game the score. Used as one measure among several, with proper samples, attention to the distribution and honest reporting of uncertainty, NPS can contribute to understanding customers. Used alone, it can mislead.
References
Anderson, E. W. (1998). Customer satisfaction and word of mouth. Journal of Service Research, 1(1), 5–17. https://doi.org/10.1177/109467059800100102
Anderson, E. W., Fornell, C., & Lehmann, D. R. (1994). Customer satisfaction, market share, and profitability: Findings from Sweden. Journal of Marketing, 58(3), 53–66. https://doi.org/10.1177/002224299405800304
Baehre, S., O'Dwyer, M., O'Malley, L., & Lee, N. (2022). The use of Net Promoter Score (NPS) to predict sales growth: Insights from an empirical investigation. Journal of the Academy of Marketing Science, 50(1), 67–84. https://doi.org/10.1007/s11747-021-00790-2
Baumgartner, H., & Steenkamp, J.-B. E. M. (2001). Response styles in marketing research: A cross-national investigation. Journal of Marketing Research, 38(2), 143–156. https://doi.org/10.1509/jmkr.38.2.143.18840
de Haan, E., Verhoef, P. C., & Wiesel, T. (2015). The predictive ability of different customer feedback metrics for retention. International Journal of Research in Marketing, 32(2), 195–206. https://doi.org/10.1016/j.ijresmar.2015.02.004
East, R., Romaniuk, J., & Lomax, W. (2011). The NPS and the ACSI: A critique and an alternative metric. International Journal of Market Research, 53(3), 327–346. https://doi.org/10.2501/IJMR-53-3-327-346
Fisher, N. I., & Kordupleski, R. E. (2019). Good and bad market research: A critical review of Net Promoter Score. Applied Stochastic Models in Business and Industry, 35(1), 138–151. https://doi.org/10.1002/asmb.2417
Fornell, C., Johnson, M. D., Anderson, E. W., Cha, J., & Bryant, B. E. (1996). The American Customer Satisfaction Index: Nature, purpose, and findings. Journal of Marketing, 60(4), 7–18. https://doi.org/10.1177/002224299606000403
Grisaffe, D. B. (2007). Questions about the ultimate question: Conceptual considerations in evaluating Reichheld's net promoter score (NPS). Journal of Consumer Satisfaction, Dissatisfaction and Complaining Behavior, 20, 36–53.
Keiningham, T. L., Aksoy, L., Cooil, B., Andreassen, T. W., & Williams, L. (2008). A holistic examination of Net Promoter. Journal of Database Marketing & Customer Strategy Management, 15(2), 79–90. https://doi.org/10.1057/dbm.2008.4
Keiningham, T. L., Cooil, B., Aksoy, L., Andreassen, T. W., & Weiner, J. (2007). The value of different customer satisfaction and loyalty metrics in predicting customer retention, recommendation, and share-of-wallet. Managing Service Quality, 17(4), 361–384. https://doi.org/10.1108/09604520710760526
Keiningham, T. L., Cooil, B., Andreassen, T. W., & Aksoy, L. (2007). A longitudinal examination of net promoter and firm revenue growth. Journal of Marketing, 71(3), 39–51. https://doi.org/10.1509/jmkg.71.3.039
Kristensen, K., & Eskildsen, J. (2014). Is the NPS a trustworthy performance measure? The TQM Journal, 26(2), 202–214. https://doi.org/10.1108/TQM-03-2011-0021
Krosnick, J. A., & Fabrigar, L. R. (1997). Designing rating scales for effective measurement in surveys. In L. Lyberg, P. Biemer, M. Collins, E. de Leeuw, C. Dippo, N. Schwarz, & D. Trewin (Eds.), Survey measurement and process quality (pp. 141–164). Wiley. https://doi.org/10.1002/9781118490013.ch6
Morgan, N. A., & Rego, L. L. (2006). The value of different customer satisfaction and loyalty metrics in predicting business performance. Marketing Science, 25(5), 426–439. https://doi.org/10.1287/mksc.1050.0180
Pingitore, G., Morgan, N. A., Rego, L. L., Gigliotti, A., & Meyers, J. (2007). The single-question trap. Marketing Research, 19(2), 9–13.
Preston, C. C., & Colman, A. M. (2000). Optimal number of response categories in rating scales: Reliability, validity, discriminating power, and respondent preferences. Acta Psychologica, 104(1), 1–15. https://doi.org/10.1016/S0001-6918(99)00050-5
Raassens, N., & Haans, H. (2017). NPS and online WOM: Investigating the relationship between customers' promoter scores and eWOM behavior. Journal of Service Research, 20(3), 322–334. https://doi.org/10.1177/1094670517696965
Reichheld, F. F. (2003). The one number you need to grow. Harvard Business Review, 81(12), 46–54.
Reichheld, F. F. (2006). The ultimate question: Driving good profits and true growth. Harvard Business School Press.
Schwarz, N., Knäuper, B., Hippler, H.-J., Noelle-Neumann, E., & Clark, L. (1991). Rating scales: Numeric values may change the meaning of scale labels. Public Opinion Quarterly, 55(4), 570–582. https://doi.org/10.1086/269282
Ye, C., Fulton, J., & Tourangeau, R. (2011). More positive or more extreme? A meta-analysis of mode differences in response choice. Public Opinion Quarterly, 75(2), 349–365. https://doi.org/10.1093/poq/nfr009