
Surveys · Sampling
Multistage Sampling Designs for Large Populations
Multistage sampling selects a sample in steps, for example areas, then households, then people. It makes surveys of large, dispersed populations affordable when no complete list of individuals exists. This article explains how the stages work, what they cost in precision and how to design and analyse them.
Imagine trying to survey a random sample of all adults in a large country by visiting them at home. There is no complete list of adults, and even if there were, a simple random sample would scatter interviewers across thousands of towns and villages, with travel costs far exceeding the cost of the interviews themselves. Multistage sampling solves both problems. The sample is selected in stages: first a sample of areas, then a sample of households within those areas, then a sample of people within households. Lists are needed only for the units selected at each stage, and interviews are concentrated in a manageable number of places (Kish, 1965; Lohr, 2022).
Most large household surveys, including labour force surveys, health surveys and many social surveys, use multistage designs. This article explains how they are built and what they mean for precision and analysis.
How the stages work
Figure 1 shows a typical three-stage design.
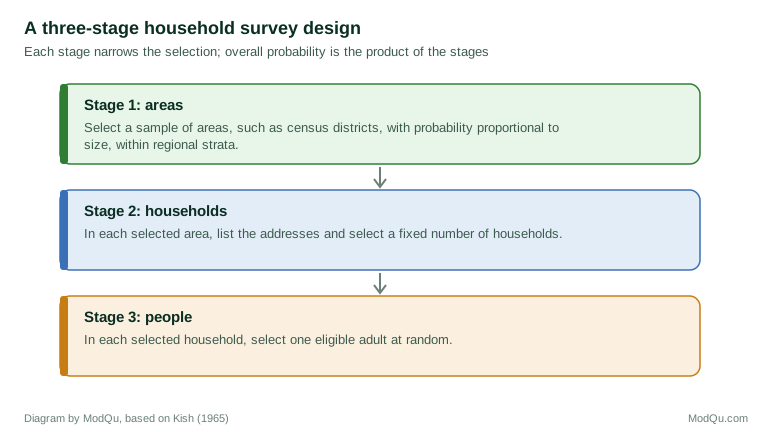
Primary sampling units (PSUs) are selected at the first stage. They are usually geographic areas, such as census districts or postcode sectors, for which population counts are available. Secondary sampling units, typically households or addresses, are selected within each chosen PSU, often after field staff have listed all dwellings in the area. Finally, one or more people may be selected within each household (Kish, 1965).
The overall probability that a person is selected is the product of the probabilities at each stage. If an area is selected with probability 1 in 50, a household within it with probability 1 in 20 and an adult within the household with probability 1 in 2, the adult's overall probability is 1 in 2,000.
Selecting PSUs with probability proportional to size
PSUs differ greatly in population. If they were selected with equal probability and the same number of households taken from each, people in large areas would be under-represented. The standard solution is to select PSUs with probability proportional to size (PPS) and then take a fixed number of households in each. A large area is more likely to be selected, but each household in it is less likely to be chosen once it is. The two effects cancel, so every household has roughly the same overall probability, giving a self-weighting sample with an equal workload in each area (Hansen & Hurwitz, 1943; Brewer & Hanif, 1983).
Stratification within multistage designs
PSUs are almost always stratified before selection, by region, urban or rural character and sometimes social or economic indicators. Stratification ensures that the sample of areas is spread across the country and improves precision (Kish, 1965). Within selected areas, addresses may be sorted geographically and selected systematically, which spreads the sample within the area as well.
The cost of clustering
Multistage designs save money because interviews are clustered. They lose precision for the same reason. People in the same area tend to resemble each other in income, housing, health and attitudes, so a second interview in the same area adds less new information than an interview elsewhere would. The loss is measured by the design effect (Kish, 1965).
For a clustered sample, the design effect is approximately 1 + (m − 1)ρ, where m is the number of interviews per cluster and ρ (rho) is the intra-cluster correlation, a measure of how similar people in the same cluster are on the variable being studied. Figure 2 shows how the design effect grows with cluster size for three values of ρ.
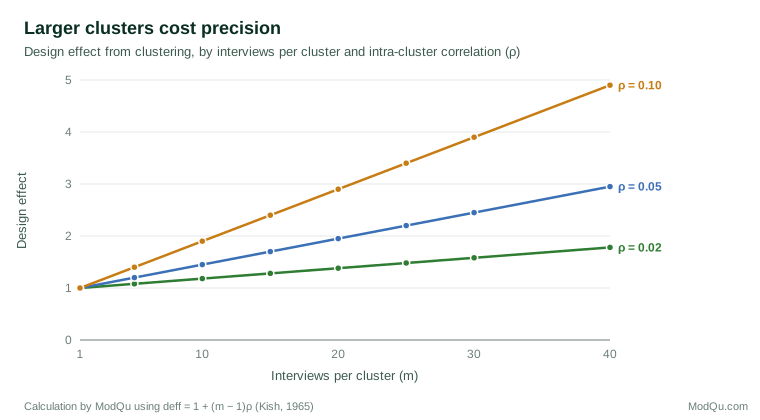
Even a small ρ matters when clusters are large. With ρ = 0.05 and 20 interviews per cluster, the design effect is about 1.95, so a sample of 2,000 gives the precision of a simple random sample of about 1,025 (illustrative calculation). Values of ρ differ by variable: they are often high for housing and income, which are strongly geographic, and lower for attitudes and personal behaviour.
Designing the stages
The main design choice is how many PSUs to select and how many interviews to take in each. More PSUs with fewer interviews each give better precision but higher travel and listing costs; fewer PSUs with more interviews each are cheaper but less precise. The optimal balance depends on the relative costs of adding a PSU and adding an interview, and on ρ for the key variables (Kish, 1965; Valliant et al., 2018). In practice, national face-to-face surveys often take somewhere between 10 and 30 interviews per PSU.
Other choices include the size and definition of PSUs, whether to use more than three stages (for example regions, districts, blocks and households) and how to select people within households. Selecting one adult per household reduces clustering within households but gives people in larger households a lower chance of selection, which must be corrected by weighting (Groves et al., 2009). Field listing of addresses must be done carefully, since listers can miss dwellings (Eckman & Kreuter, 2011).
Single-stage and multistage cluster samples
In a single-stage cluster sample, every unit in each selected cluster is surveyed, as when all employees in a sample of branches are interviewed. In a multistage sample, units are subsampled within selected clusters. Subsampling usually improves precision for a fixed number of interviews, because it allows more clusters to be selected, and it keeps the workload in each cluster under control when clusters vary in size (Cochran, 1977; Kalton, 1983). Single-stage designs remain useful when clusters are small or when interviewing everyone in a cluster costs little more than interviewing some of them, as in a school where a whole class can complete a questionnaire at once.
Selecting people within households
The last stage of many household surveys selects one person from those eligible in the household. Kish (1949) proposed an objective procedure, now known as the Kish grid, in which the interviewer lists eligible members in a set order and uses a pre-printed table to pick one. Simpler methods, such as choosing the adult with the next or most recent birthday, are quicker and less intrusive but are not always applied correctly by respondents. A review of within-household selection methods found trade-offs between how closely each method approximates random selection and how much it affects cooperation (Gaziano, 2005). Whatever the method, the selected person's weight must reflect the number of eligible people in the household.
Planning with design effects
Designers need values of ρ and design effects before fieldwork, to choose cluster sizes and total sample size. These are usually taken from earlier rounds of the same survey or from similar surveys. Kish (1995) recommended that surveys compute and publish design effects for their main estimates so that future designers can use them, and textbooks give methods for estimating ρ from survey data (Levy & Lemeshow, 2008). Because ρ varies by variable, designers should plan using the variables that matter most, and accept that precision will be lower for strongly clustered measures. Weighting adds a further component to the design effect, which should be included in planning (Kish, 1995).
Weighting and analysis
Even well-designed multistage samples need weights. Weights correct for unequal selection probabilities, such as those created by selecting one adult per household, and then adjust for nonresponse and align the sample with population totals (Valliant et al., 2018).
Analysis must take the design into account. Standard errors calculated as if the sample were a simple random sample are usually too small for multistage samples, sometimes by a wide margin, which leads to overconfident conclusions (Kish & Frankel, 1974). Survey analysis software estimates standard errors using the strata and PSUs, through methods such as Taylor series linearisation or replication methods like the jackknife and balanced repeated replication (Wolter, 2007; Lumley, 2010). Data files from multistage surveys therefore include variables identifying the stratum and PSU of each respondent, which users should always apply.
Multistage designs in other settings
The same logic applies beyond households. Education surveys select schools, then classes, then pupils. Business surveys may select firms, then establishments, then employees. Customer research may select stores and then customers within stores. In each case, the principles are the same: select clusters with appropriate probabilities, sample within them, weight by the inverse of the overall probability and analyse with methods that account for clustering. Cross-national surveys apply multistage designs in each country while aiming for comparable precision, using design effects to set sample sizes (Lynn et al., 2007).
An example
A national health survey aims to interview 6,000 adults. Its designers stratify the country into 20 regional strata, divided into urban and rural areas, and select 300 census districts with probability proportional to population. In each district, field staff list all addresses, and 25 are selected systematically, expecting about 20 interviews after nonresponse and ineligible addresses. One adult is selected at random in each household. With an expected ρ of 0.04 for key health measures and 20 interviews per district, the design effect from clustering is about 1.76, giving an effective sample of around 3,400. The designers judge this sufficient for national estimates and for broad regional comparisons, and record stratum and district codes on the data file for analysis (illustrative example).
Conclusion
Multistage sampling makes probability surveys of large populations possible by selecting areas, then households, then people, so that lists are needed only for selected places and fieldwork is concentrated. Probability proportional to size selection keeps samples close to self-weighting, and stratification improves precision. The price is clustering, which raises the design effect, especially when many interviews are taken in each cluster and people within clusters are similar. Good design balances cost and precision, and good analysis always uses the strata, clusters and weights (Kish, 1965; Hansen et al., 1953; Lohr, 2022).
References
Brewer, K. R. W., & Hanif, M. (1983). Sampling with unequal probabilities. Springer. https://doi.org/10.1007/978-1-4684-9407-5
Cochran, W. G. (1977). Sampling techniques (3rd ed.). Wiley.
Eckman, S., & Kreuter, F. (2011). Confirmation bias in housing unit listing. Public Opinion Quarterly, 75(1), 139–150. https://doi.org/10.1093/poq/nfq066
Gaziano, C. (2005). Comparative analysis of within-household respondent selection techniques. Public Opinion Quarterly, 69(1), 124–157. https://doi.org/10.1093/poq/nfi006
Groves, R. M., Fowler, F. J., Jr., Couper, M. P., Lepkowski, J. M., Singer, E., & Tourangeau, R. (2009). Survey methodology (2nd ed.). Wiley.
Hansen, M. H., & Hurwitz, W. N. (1943). On the theory of sampling from finite populations. Annals of Mathematical Statistics, 14(4), 333–362. https://doi.org/10.1214/aoms/1177731356
Hansen, M. H., Hurwitz, W. N., & Madow, W. G. (1953). Sample survey methods and theory (Vols. 1–2). Wiley.
Kalton, G. (1983). Introduction to survey sampling. SAGE. https://doi.org/10.4135/9781412984683
Kish, L., & Frankel, M. R. (1974). Inference from complex samples. Journal of the Royal Statistical Society: Series B (Methodological), 36(1), 1–37. https://doi.org/10.1111/j.2517-6161.1974.tb00981.x
Kish, L. (1949). A procedure for objective respondent selection within the household. Journal of the American Statistical Association, 44(247), 380–387. https://doi.org/10.1080/01621459.1949.10483314
Kish, L. (1965). Survey sampling. Wiley.
Kish, L. (1995). Methods for design effects. Journal of Official Statistics, 11(1), 55–77.
Levy, P. S., & Lemeshow, S. (2008). Sampling of populations: Methods and applications (4th ed.). Wiley. https://doi.org/10.1002/9780470374597
Lohr, S. L. (2022). Sampling: Design and analysis (3rd ed.). CRC Press. https://doi.org/10.1201/9780429298899
Lumley, T. (2010). Complex surveys: A guide to analysis using R. Wiley. https://doi.org/10.1002/9780470580066
Lynn, P., Häder, S., Gabler, S., & Laaksonen, S. (2007). Methods for achieving equivalence of samples in cross-national surveys: The European Social Survey experience. Journal of Official Statistics, 23(1), 107–124.
Valliant, R., Dever, J. A., & Kreuter, F. (2018). Practical tools for designing and weighting survey samples (2nd ed.). Springer. https://doi.org/10.1007/978-3-319-93632-1
Wolter, K. M. (2007). Introduction to variance estimation (2nd ed.). Springer. https://doi.org/10.1007/978-0-387-35099-8