
Surveys · Questionnaire design
Measuring Frequency and Behaviour Accurately in Self-Reports
Questions about how often people do things are among the most common in surveys and among the hardest to answer accurately. This article explains how respondents produce frequency answers, the errors that result and the design techniques that improve accuracy.
"How many times did you visit a doctor in the past twelve months?" "How often do you buy groceries online?" "How many hours a week do you spend on social media?" Questions about the frequency of behaviour are among the most common in surveys. Health researchers use them to estimate the use of services, marketers use them to size markets and segment customers, and governments use them to measure everything from travel to volunteering.
They are also among the hardest questions to answer accurately. Most people do not keep a running count of how often they do everyday things. When asked, they must reconstruct an answer from memory, estimates and general impressions, and the result is shaped by the question as much as by the behaviour. This article explains how respondents produce answers to frequency questions, describes the main sources of error and sets out design techniques that improve accuracy.
How respondents produce a number
Research in survey methodology and cognitive psychology has shown that respondents use several different strategies to answer frequency questions (Blair & Burton, 1987; Tourangeau et al., 2000).
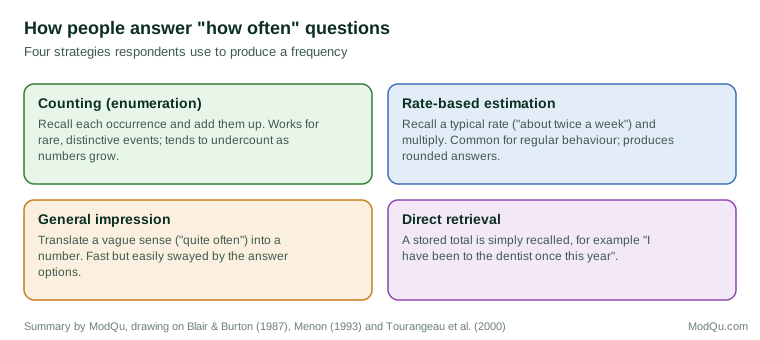
Counting. The respondent tries to recall each occurrence and add them up. This works well for rare and distinctive events, such as hospital stays or overseas trips, but becomes impractical for frequent ones. Because some events are always forgotten, counting tends to produce answers that are too low, and the shortfall grows with the number of events.
Rate-based estimation. The respondent recalls a typical rate, such as "about twice a week," and multiplies it by the length of the reference period. This is the usual strategy for regular, frequent behaviours. It avoids the need to recall individual events but ignores irregularities such as holidays or illness, and it produces rounded answers.
General impression. The respondent has a vague sense of how often something happens, such as "quite often," and translates it into a number or a response category. This is the fastest strategy and the one most easily influenced by the wording and the answer options.
Direct retrieval. For a few behaviours, people have a stored total that they can simply recall, such as the number of children they have or the number of times they have moved house.
Which strategy respondents use depends on the behaviour and the task. Blair and Burton found that respondents were more likely to count when the number of events was small and more likely to estimate when it was large (Blair & Burton, 1987). In later experiments, giving respondents more time and encouraging them to think carefully increased the use of counting and changed the answers they gave (Burton & Blair, 1991). Behaviours that occur regularly are more often estimated from a rate, while irregular behaviours are more often counted or judged from a general impression (Menon, 1993). Bradburn and colleagues summarised the evidence by concluding that many answers to questions about past behaviour are based on inference and estimation rather than direct recall (Bradburn et al., 1987).
Sources of error
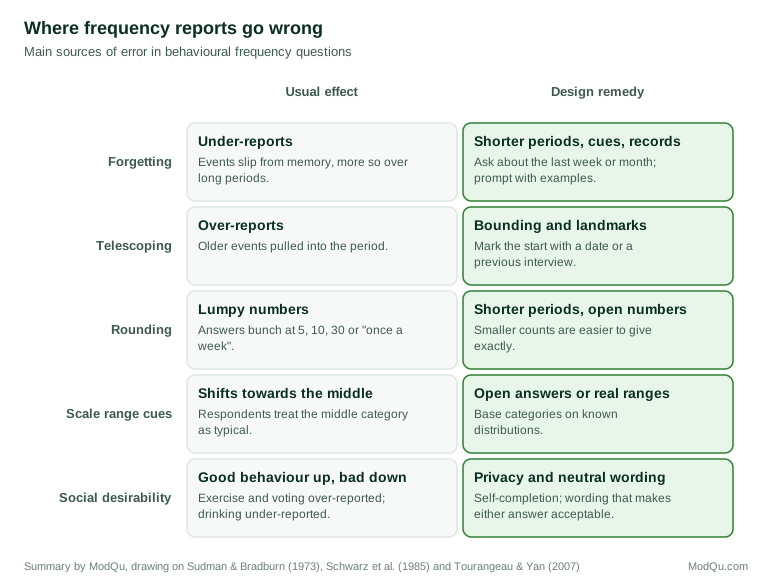
Forgetting
Memory for everyday events fades quickly, and the longer the reference period, the more events are forgotten. Seymour Sudman and Norman Bradburn reviewed many studies and showed that omissions increase with the length of time since the event, and that the effect is stronger for less important events (Sudman & Bradburn, 1973). Routine behaviours, such as shopping trips or snacks, are particularly hard to recall individually, because similar events blur together in memory (Means & Loftus, 1991).
Telescoping
At the same time, respondents tend to remember events as more recent than they were, so events from before the reference period are wrongly included. This telescoping error inflates reports and is strongest for short reference periods, where a few misplaced events make a large difference. A classic study of household spending on home repairs showed that unbounded recall over-reported recent expenditure because jobs done earlier were pulled forward into the reference period (Neter & Waksberg, 1964). Forgetting and telescoping work in opposite directions, so their net effect depends on the length of the period and the type of event (Sudman & Bradburn, 1973).
Rounding and heaping
Answers to frequency questions bunch at round numbers. Respondents report 5, 10, 20 or 30 much more often than 7, 13 or 22, and reports of elapsed time cluster at conventional values such as a week, two weeks or a month (Huttenlocher et al., 1990). This heaping reflects the use of estimation strategies and makes precise answers impossible for frequent behaviours. Heaping is less of a problem for short reference periods and small counts.
Cues from the answer options
When frequency questions are asked with response categories, the categories themselves influence the answers. In a well-known experiment, respondents reported more television viewing when the response scale covered high values than when it covered low values. Respondents treated the middle of the scale as typical and placed their own viewing relative to it (Schwarz et al., 1985). The scale also affected respondents' judgements of other things: those given the low-range scale, who appeared to themselves to watch more than average, rated television as more important in their lives.
Vague quantifiers such as "rarely," "sometimes" and "often" cause a related problem. They mean different things to different people and for different behaviours: "often" for visits to the cinema means something very different from "often" for drinking coffee. Comparisons of groups using vague quantifiers can therefore be misleading, because groups may interpret the terms differently (Schaeffer, 1991).
Social desirability
Some behaviours carry social approval or disapproval, and reports shift accordingly. Exercise, voting, reading and charitable giving tend to be over-reported; smoking, drinking, drug use and unhealthy eating tend to be under-reported (Tourangeau & Yan, 2007). Validation studies that compared survey reports of voting with official records found substantial over-reporting, concentrated among groups for whom voting is a stronger social norm, such as the more educated (Silver et al., 1986).
Proxy reporting
Many surveys ask one person to report on the behaviour of others in the household, such as a parent reporting a child's screen time or one adult reporting the household's spending. These proxy reports add a further layer of error, because the reporter may not know about events that happened when they were not present and must rely even more on estimation. Proxy reports tend to be less complete for private, occasional or socially sensitive behaviours and more accurate for shared, visible ones (Tourangeau et al., 2000). Surveys that use proxies should record who answered, so that differences between self and proxy reports can be examined.
Duration and amounts
Questions about how long something lasted, or how much was spent, raise similar problems. Durations are usually estimated rather than recalled, and they are especially prone to rounding to five-minute, quarter-hour or hour values (Huttenlocher et al., 1990). Estimates of time spent on activities that people value, such as work, or that are fragmented across the day, such as using a phone, are particularly hard to make accurately (Juster et al., 2003). Amounts of money suffer from the same mix of forgetting and estimation, and they are also affected by the respondent's knowledge of household finances.
Comparing self-reports with direct measures
When behaviour can be measured directly, the gap between self-reports and reality is often large. A systematic review comparing self-reported physical activity with direct measures, such as accelerometers, found that self-reports were sometimes higher and sometimes lower than measured activity, and that the two were often only weakly correlated (Prince et al., 2008). Studies of time use show that estimates of hours spent on activities such as work, obtained through direct questions, often differ from totals derived from time diaries, in which respondents record their activities in sequence (Juster et al., 2003; Robinson & Godbey, 1997). Among adolescents, the validity of self-reported health-risk behaviours depends on the behaviour, the setting and the perceived privacy of the survey (Brener et al., 2003).
Design techniques that improve accuracy
Choose the reference period carefully
The reference period should match the frequency of the behaviour and the purpose of the survey. Short periods, such as the past seven days, reduce forgetting and make counting feasible for frequent behaviours, but they are more vulnerable to telescoping and may miss irregular behaviours. Longer periods capture rare events but increase forgetting. A practical rule is to use short periods for frequent, routine behaviours and longer periods for rare, salient events (Sudman & Bradburn, 1973; Bradburn et al., 2004). When annual figures are needed for a frequent behaviour, it is often better to ask about a short recent period and scale up.
Define the behaviour precisely
Respondents need to know exactly what counts. "How often do you exercise?" leaves open whether a walk to the shops counts. "On how many days in the past seven days did you do at least thirty minutes of activity that made you breathe harder than normal?" is longer but much clearer. Definitions should be included in the question, not in separate instructions that respondents may skip (Fowler, 1995).
Help memory
Several techniques improve recall:
- Cues and examples. Listing the types of event that count, such as different kinds of medical visit, helps respondents remember instances they might otherwise miss.
- Decomposition. Breaking a general question into specific parts, such as asking separately about visits to a family doctor, a specialist and a hospital, can improve recall of recurring events (Means & Loftus, 1991).
- Landmarks and calendars. Anchoring the reference period to a memorable date ("since New Year's Day") reduces telescoping. Event history calendars, which help respondents place events in relation to each other, improve the quality of retrospective reports in some domains (Belli, 1998; Belli et al., 2001).
- Records. Encouraging respondents to consult bank statements, receipts or calendars improves accuracy for spending and appointments.
- Time and motivation. Asking respondents to take their time, and explaining why accuracy matters, increases careful recall (Cannell et al., 1981; Burton & Blair, 1991).
Ask for numbers where possible
Open numeric questions ("How many times...?") avoid the frame-of-reference effects of response categories (Schwarz, 1999). When categories are needed, for example in a short mobile survey, they should be based on the actual distribution of the behaviour in the population, so that the middle categories reflect typical values, and they should use specific frequencies ("once a week," "two or three times a week") rather than vague quantifiers.
Reduce social pressure
For sensitive behaviours, self-administered modes, such as web or private computer-assisted interviewing, produce more reports of undesirable behaviours than interviewer administration. Wording that makes either answer acceptable ("Some people have time to exercise regularly and others do not...") can also reduce pressure (Tourangeau & Yan, 2007; Bradburn et al., 2004).
Consider alternative methods
When accuracy is critical, alternatives to retrospective questions may be worth their extra cost. Time diaries ask respondents to record activities over a day or week as they happen or soon afterwards. Ecological momentary assessment asks respondents brief questions on a phone several times a day, capturing behaviour close to when it occurs (Shiffman et al., 2008). The day reconstruction method asks respondents to reconstruct the previous day as a sequence of episodes, which reduces the reliance on general impressions (Kahneman et al., 2004). Linking survey data with administrative records or device data is another option where consent and privacy rules allow.
A worked example
Suppose an online grocery company wants to know how often its customers order and how much they spend on groceries overall. A first draft might ask: "How often do you buy groceries online? Rarely / Sometimes / Often / Very often." The answers would be hard to interpret, because "often" means different things to different customers, and they could not be converted into a number of orders.
A better version would ask: "In the past four weeks, on how many separate occasions did you order groceries online for delivery or collection? Please count each order separately, even if it was a small top-up." This version defines the behaviour (orders, including small ones), sets a reference period that suits a behaviour most customers do between once a week and once a month, and asks for a number rather than a vague quantifier. To reduce telescoping, the question could name the start of the period ("since Monday 5 October"). To help memory, it could prompt respondents to think about weekdays and weekends separately, or to check their order history in the app.
Overall grocery spending is harder still. Customers rarely know their monthly grocery spend and will estimate it from a typical weekly shop. A useful approach is to ask about the most recent week ("About how much did your household spend on groceries in the past seven days, including shops, markets and online orders?") and to accept that the answer is an estimate. Comparing survey answers with the company's own order data for customers who agree to the link shows how accurate the estimates are and whether particular groups, such as frequent small-basket shoppers, tend to under- or over-report.
Testing frequency questions
Frequency questions should be tested before use. Cognitive interviews, in which respondents explain how they arrived at their answer, show which strategy they used and whether they understood the definitions and the reference period (Bradburn et al., 2004). A respondent who says "I go about twice a week, so I put eight" has used a rate-based estimate; one who says "I counted the times I could remember" may have undercounted. Pilot data reveal heaping, implausible values and items that many respondents leave blank. Where records are available, a small validation study comparing reports with records gives the most direct evidence of accuracy.
Implications for business research
Business surveys often depend on frequency questions: how often customers buy a product, visit a store or use an app. These answers feed into forecasts, market sizing and segmentation. The errors described above can make such estimates misleading in predictable ways. Heavy users of frequent, routine products tend to underestimate their use when counting and to give rounded answers when estimating. Occasional users of salient products may over-report through telescoping. Behaviours with a social dimension, such as eating healthily or buying sustainable products, are likely to be over-reported.
Where a company has its own transaction or usage data, comparing these with survey reports for a sample of customers who agree to the link can reveal the size and direction of reporting errors. That calibration can then be used to interpret survey data for customers whose behaviour is not otherwise observed.
Conclusion
Answers to frequency questions are constructed, not retrieved. Respondents count, estimate from a rate or translate a general impression into a number, and each strategy brings characteristic errors: forgetting, telescoping, rounding, sensitivity to answer options and social desirability. Careful design reduces these errors. Reference periods should suit the behaviour, definitions should be precise, memory should be supported with cues, landmarks and records, numbers should be asked for directly where possible and sensitive behaviours should be asked about privately. When accuracy matters greatly, diaries, momentary assessment and linked records can supplement or replace retrospective questions (Krosnick & Presser, 2010).
References
Belli, R. F. (1998). The structure of autobiographical memory and the event history calendar: Potential improvements in the quality of retrospective reports in surveys. Memory, 6(4), 383–406. https://doi.org/10.1080/741942610
Belli, R. F., Shay, W. L., & Stafford, F. P. (2001). Event history calendars and question list surveys: A direct comparison of interviewing methods. Public Opinion Quarterly, 65(1), 45–74. https://doi.org/10.1086/320037
Blair, E., & Burton, S. (1987). Cognitive processes used by survey respondents to answer behavioral frequency questions. Journal of Consumer Research, 14(2), 280–288. https://doi.org/10.1086/209112
Bradburn, N. M., Rips, L. J., & Shevell, S. K. (1987). Answering autobiographical questions: The impact of memory and inference on surveys. Science, 236(4798), 157–161. https://doi.org/10.1126/science.3563494
Bradburn, N. M., Sudman, S., & Wansink, B. (2004). Asking questions: The definitive guide to questionnaire design for market research, political polls, and social and health questionnaires (Rev. ed.). Jossey-Bass.
Brener, N. D., Billy, J. O. G., & Grady, W. R. (2003). Assessment of factors affecting the validity of self-reported health-risk behavior among adolescents: Evidence from the scientific literature. Journal of Adolescent Health, 33(6), 436–457. https://doi.org/10.1016/S1054-139X(03)00052-1
Burton, S., & Blair, E. (1991). Task conditions, response formulation processes, and response accuracy for behavioral frequency questions in surveys. Public Opinion Quarterly, 55(1), 50–79. https://doi.org/10.1086/269241
Cannell, C. F., Miller, P. V., & Oksenberg, L. (1981). Research on interviewing techniques. Sociological Methodology, 12, 389–437. https://doi.org/10.2307/270748
Fowler, F. J., Jr. (1995). Improving survey questions: Design and evaluation. SAGE.
Huttenlocher, J., Hedges, L. V., & Bradburn, N. M. (1990). Reports of elapsed time: Bounding and rounding processes in estimation. Journal of Experimental Psychology: Learning, Memory, and Cognition, 16(2), 196–213. https://doi.org/10.1037/0278-7393.16.2.196
Juster, F. T., Ono, H., & Stafford, F. P. (2003). An assessment of alternative measures of time use. Sociological Methodology, 33(1), 19–54. https://doi.org/10.1111/j.0081-1750.2003.t01-1-00126.x
Kahneman, D., Krueger, A. B., Schkade, D. A., Schwarz, N., & Stone, A. A. (2004). A survey method for characterizing daily life experience: The day reconstruction method. Science, 306(5702), 1776–1780. https://doi.org/10.1126/science.1103572
Krosnick, J. A., & Presser, S. (2010). Question and questionnaire design. In P. V. Marsden & J. D. Wright (Eds.), Handbook of survey research (2nd ed., pp. 263–313). Emerald.
Means, B., & Loftus, E. F. (1991). When personal history repeats itself: Decomposing memories for recurring events. Applied Cognitive Psychology, 5(4), 297–318. https://doi.org/10.1002/acp.2350050402
Menon, G. (1993). The effects of accessibility of information in memory on judgments of behavioral frequencies. Journal of Consumer Research, 20(3), 431–440. https://doi.org/10.1086/209359
Neter, J., & Waksberg, J. (1964). A study of response errors in expenditures data from household interviews. Journal of the American Statistical Association, 59(305), 18–55. https://doi.org/10.1080/01621459.1964.10480699
Prince, S. A., Adamo, K. B., Hamel, M. E., Hardt, J., Connor Gorber, S., & Tremblay, M. (2008). A comparison of direct versus self-report measures for assessing physical activity in adults: A systematic review. International Journal of Behavioral Nutrition and Physical Activity, 5, Article 56. https://doi.org/10.1186/1479-5868-5-56
Robinson, J. P., & Godbey, G. (1997). Time for life: The surprising ways Americans use their time. Pennsylvania State University Press.
Schaeffer, N. C. (1991). Hardly ever or constantly? Group comparisons using vague quantifiers. Public Opinion Quarterly, 55(3), 395–423. https://doi.org/10.1086/269270
Schwarz, N. (1999). Self-reports: How the questions shape the answers. American Psychologist, 54(2), 93–105. https://doi.org/10.1037/0003-066X.54.2.93
Schwarz, N., Hippler, H.-J., Deutsch, B., & Strack, F. (1985). Response scales: Effects of category range on reported behavior and comparative judgments. Public Opinion Quarterly, 49(3), 388–395. https://doi.org/10.1086/268936
Shiffman, S., Stone, A. A., & Hufford, M. R. (2008). Ecological momentary assessment. Annual Review of Clinical Psychology, 4, 1–32. https://doi.org/10.1146/annurev.clinpsy.3.022806.091415
Silver, B. D., Anderson, B. A., & Abramson, P. R. (1986). Who overreports voting? American Political Science Review, 80(2), 613–624. https://doi.org/10.2307/1958277
Sudman, S., & Bradburn, N. M. (1973). Effects of time and memory factors on response in surveys. Journal of the American Statistical Association, 68(344), 805–815. https://doi.org/10.1080/01621459.1973.10481428
Tourangeau, R., & Yan, T. (2007). Sensitive questions in surveys. Psychological Bulletin, 133(5), 859–883. https://doi.org/10.1037/0033-2909.133.5.859
Tourangeau, R., Rips, L. J., & Rasinski, K. (2000). The psychology of survey response. Cambridge University Press. https://doi.org/10.1017/CBO9780511819322