
Surveys · Types and applications
Customer Satisfaction Surveys: Design, Metrics and Interpretation
Customer satisfaction surveys are among the most common surveys organisations run. This article explains the theory behind satisfaction, the main metrics, how to design the questionnaire and sample, and how to interpret the results without being misled.
Customer satisfaction surveys are probably the most widely conducted surveys in the world. Retailers, banks, airlines, hospitals, software companies and public services all ask their customers how satisfied they are. The results feed into management dashboards, bonuses and decisions about products and services. Yet satisfaction surveys are often designed quickly, sampled carelessly and interpreted without regard to the biases they contain. This article explains what satisfaction is, how it is measured and how to design and interpret satisfaction surveys so that they produce reliable knowledge.
What is customer satisfaction?
The most influential account of satisfaction is the expectation–disconfirmation model (Oliver, 1980). Customers form expectations before a purchase, experience the product or service and compare the experience with their expectations. When experience meets or exceeds expectations, they are satisfied; when it falls short, they are dissatisfied. Satisfaction in turn influences behaviour: whether customers buy again, recommend the company or complain. Figure 1 shows the sequence.
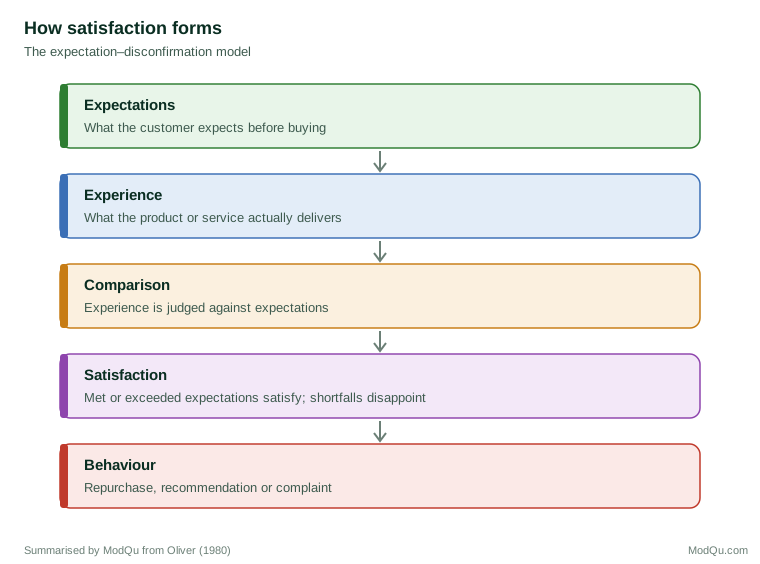
The model has practical implications. Satisfaction depends on expectations as well as performance, so a company that raises expectations through advertising may lower satisfaction even if its service improves. Comparisons of satisfaction between customer groups may reflect different expectations rather than different experiences.
Researchers distinguish transaction-specific satisfaction, with a particular purchase or contact, from cumulative satisfaction, the overall evaluation of a company built up over time. Cumulative satisfaction is a better predictor of loyalty and business performance (Anderson et al., 1994).
Why satisfaction matters
Satisfaction is measured because it is believed to drive business results. Evidence supports this belief, with qualifications. Anderson et al. (1994) found that customer satisfaction in Swedish companies was associated with later profitability. Anderson and Sullivan (1993) found that satisfaction was linked to repurchase intentions. Anderson (1998) found that both very satisfied and very dissatisfied customers spread word of mouth, with dissatisfied customers somewhat more active. Szymanski and Henard (2001) carried out a meta-analysis and found that satisfaction was strongly related to repeat purchase and word of mouth, though the strength of these relationships varied between studies. Mittal and Kamakura (2001) showed that the link between stated satisfaction and actual repurchase differed between customer groups: at the same level of satisfaction, some groups were much more likely to buy again than others.
National satisfaction indices
Several countries track customer satisfaction at the national level. Sweden introduced a national customer satisfaction barometer in 1989 (Fornell, 1992), and the American Customer Satisfaction Index followed in 1994 (Fornell et al., 1996). These indices use a common model in which satisfaction is caused by expectations, perceived quality and perceived value, and in turn affects complaints and loyalty. They measure satisfaction with companies and sectors using the same questions over time, which allows comparison across industries and years.
The main metrics
Organisations use several metrics:
- Customer satisfaction score (CSAT). Customers rate their satisfaction, usually on a five-point scale, and the score is reported as the percentage choosing the top one or two categories, or as an average.
- Net Promoter Score (NPS). Customers rate how likely they are to recommend the company on a scale from 0 to 10. The score is the percentage of "promoters" (9–10) minus the percentage of "detractors" (0–6) (Reichheld, 2003). NPS is covered in a separate article.
- Customer effort score (CES). Customers rate how easy it was to get an issue resolved, reflecting evidence that reducing effort matters more for loyalty than exceeding expectations (Dixon et al., 2010).
- Multi-item indices. Indices such as the American Customer Satisfaction Index combine several questions to measure satisfaction more reliably than a single item.
Comparisons of metrics show that no single measure is clearly best for predicting business performance. Morgan and Rego (2006) found that satisfaction measures, including average satisfaction and the proportion of satisfied customers, predicted future business performance better than recommendation-based measures. Keiningham et al. (2007) found no evidence that NPS predicted company growth better than other measures. Gupta and Zeithaml (2006) reviewed customer metrics and concluded that satisfaction was linked to financial performance, but that the strength of the link varied by industry.
Designing the questionnaire
A good satisfaction survey measures overall satisfaction and the specific aspects that drive it.
Overall satisfaction. One or more questions ask about satisfaction with the company, product or service as a whole. A fully labelled scale, for example from "very dissatisfied" to "very satisfied", is easier to interpret than a numerical scale.
Attributes. Questions about specific aspects, such as price, quality, staff, speed and ease of use, show where performance is strong or weak. The aspects should be chosen through qualitative research with customers, not only from management's assumptions. The SERVQUAL instrument, developed for services, covers five dimensions: tangibles, reliability, responsiveness, assurance and empathy (Parasuraman et al., 1988).
Behaviour and intentions. Questions about repurchase intention, recommendation and complaints connect satisfaction to outcomes.
Open questions. An open question asking what the company could do better often yields the most useful information for improvement.
Response scales need care. Agree–disagree statements are prone to acquiescence, the tendency to agree regardless of content, which varies between cultures (Baumgartner & Steenkamp, 2001). Item-specific scales, which ask directly about satisfaction or quality, reduce this problem.
The skew of satisfaction ratings
Satisfaction ratings are almost always skewed towards the positive end of the scale. Peterson and Wilson (1992) reviewed satisfaction studies and found that most customers reported being satisfied, regardless of industry. Figure 2 illustrates the typical pattern.
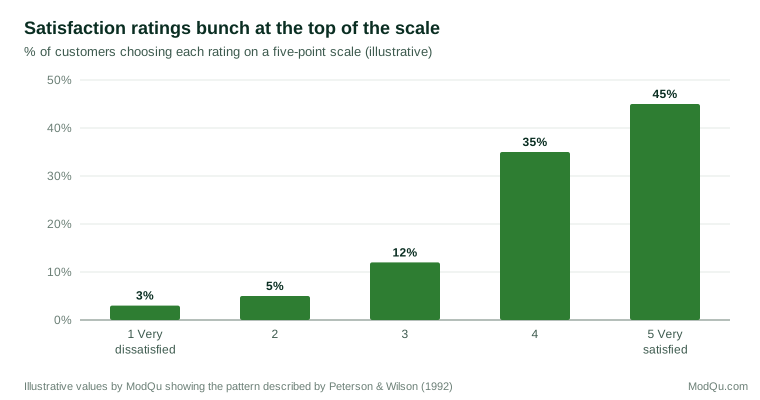
Skew has several causes: customers who are very dissatisfied may have stopped being customers and so are not surveyed; people tend to give positive ratings; and question wording and mode affect answers. Telephone interviews produce more positive and more extreme ratings than self-administered modes (Ye et al., 2011). Because most answers fall in the top categories, small differences in the top-box percentage may be meaningful, and analysis should focus on the share of customers who are not fully satisfied, where the opportunities for improvement lie.
Satisfaction is not linear
The relationship between attribute performance and overall satisfaction is often asymmetric. Mittal et al. (1998) found that poor performance on an attribute reduced overall satisfaction and repurchase intentions more than good performance on the same attribute increased them. Fixing what customers dislike may therefore matter more than improving what they already rate well. Driver analysis that assumes a straight-line relationship can miss this pattern; examining the effect of low and high ratings separately, or using categories such as "must-have" and "delighter" attributes, gives a more accurate picture.
Timing and mode
When a survey is sent affects what it measures. A survey sent immediately after a transaction captures the experience while it is fresh but reflects that single contact; one sent later reflects a broader, cumulative view. Very long delays reduce recall and response. Mode also matters. Ratings collected by telephone interviewers tend to be more positive than those collected online or on paper (Ye et al., 2011), so a change of mode can produce an apparent change in satisfaction. Trends should be compared only within the same mode, or the effect of a mode change should be measured with a parallel run. Invitations should come from a credible sender and explain how results will be used (Dillman et al., 2014).
Satisfaction with public services
Governments also survey citizens about public services, from waste collection to health care. The expectation–disconfirmation model applies here too. Van Ryzin (2004) found that citizens' satisfaction with urban services in New York depended on their expectations as well as on perceived performance, which means that satisfaction scores can fall when expectations rise, even if services improve. Comparisons between areas or services need to take differences in expectations into account.
Using open answers
Open answers often contain the most useful information in a satisfaction survey, because they show why customers feel as they do. With large samples, reading every comment is impractical, and text analysis software can classify comments by topic and tone. Automated classification should be checked against a sample coded by people, since software can misread sarcasm, mixed comments and industry terms. Reporting a few representative quotations alongside the numbers helps managers understand what customers mean.
Sampling and response
Who is surveyed matters as much as what is asked. Common problems include:
- Self-selection. Surveys that rely on customers choosing to give feedback, such as links on receipts or websites, over-represent customers with strong opinions, either very positive or very negative.
- Survivorship. Surveys of current customers miss those who have left, often the most dissatisfied.
- Gaming. When staff are rewarded for high scores, they may encourage customers to give high ratings or select which customers are surveyed.
- Over-surveying. Customers asked after every transaction become fatigued and stop responding.
A random sample of customers, drawn from transaction records and contacted by the research team rather than by front-line staff, avoids most of these problems. Including former customers gives a fuller picture.
Analysing and interpreting results
Key driver analysis identifies which attributes have the strongest relationship with overall satisfaction, often using regression or correlation. Attributes with both a strong relationship and low performance are priorities for improvement. Driver analysis shows association, not causation, and results can be unstable when attributes are highly correlated with one another.
Trends over time are usually more informative than single results. Changes should be judged against sampling error: with a sample of 400, a change of three or four percentage points in the share of satisfied customers may not be meaningful.
Benchmarking against competitors or industry averages requires comparable questions, scales, modes and samples. Comparisons of scores collected in different ways can mislead.
Linking to behaviour, by matching survey answers to later purchases or account closures, shows whether satisfaction actually predicts the outcomes the organisation cares about (Mittal & Kamakura, 2001).
Reporting results
Reports should state the question wording, the scale, the mode, the sample size, the response rate and how customers were selected, so that readers can judge how far the results can be trusted. Results for small groups, such as a single branch or a single month, should be shown with margins of error or combined over longer periods. Showing the full distribution of ratings, not only the top-box percentage, helps managers see whether change comes from fewer very dissatisfied customers or more very satisfied ones.
An example
A regional bank surveys a random sample of 1,200 customers each quarter by web, using a mailed invitation. Overall satisfaction is 82 per cent satisfied or very satisfied. Driver analysis shows that satisfaction with resolving problems has the strongest relationship with overall satisfaction and the lowest score. The bank links survey answers to account data and finds that customers who were dissatisfied with problem resolution were twice as likely to close an account in the following year. It changes its complaints process, and over the next four quarters the problem-resolution score rises by nine points and account closures among recent complainants fall (illustrative example).
Conclusion
Customer satisfaction surveys can provide valuable knowledge about what customers experience and what drives their loyalty. Their value depends on sound theory, careful questionnaire design, random sampling and honest interpretation. Satisfaction ratings are skewed, sensitive to mode and wording, and easily distorted by self-selection and incentives for staff. Organisations that recognise these issues, focus on change over time and on the drivers of dissatisfaction, and link survey results to actual behaviour get the most useful knowledge from their satisfaction surveys.
References
Anderson, E. W., & Sullivan, M. W. (1993). The antecedents and consequences of customer satisfaction for firms. Marketing Science, 12(2), 125–143. https://doi.org/10.1287/mksc.12.2.125
Anderson, E. W. (1998). Customer satisfaction and word of mouth. Journal of Service Research, 1(1), 5–17. https://doi.org/10.1177/109467059800100102
Anderson, E. W., Fornell, C., & Lehmann, D. R. (1994). Customer satisfaction, market share, and profitability: Findings from Sweden. Journal of Marketing, 58(3), 53–66. https://doi.org/10.1177/002224299405800304
Baumgartner, H., & Steenkamp, J.-B. E. M. (2001). Response styles in marketing research: A cross-national investigation. Journal of Marketing Research, 38(2), 143–156. https://doi.org/10.1509/jmkr.38.2.143.18840
Dillman, D. A., Smyth, J. D., & Christian, L. M. (2014). Internet, phone, mail, and mixed-mode surveys: The tailored design method (4th ed.). Wiley.
Dixon, M., Freeman, K., & Toman, N. (2010). Stop trying to delight your customers. Harvard Business Review, 88(7/8), 116–122.
Fornell, C. (1992). A national customer satisfaction barometer: The Swedish experience. Journal of Marketing, 56(1), 6–21. https://doi.org/10.1177/002224299205600103
Fornell, C., Johnson, M. D., Anderson, E. W., Cha, J., & Bryant, B. E. (1996). The American Customer Satisfaction Index: Nature, purpose, and findings. Journal of Marketing, 60(4), 7–18. https://doi.org/10.1177/002224299606000403
Gupta, S., & Zeithaml, V. (2006). Customer metrics and their impact on financial performance. Marketing Science, 25(6), 718–739. https://doi.org/10.1287/mksc.1060.0221
Keiningham, T. L., Cooil, B., Andreassen, T. W., & Aksoy, L. (2007). A longitudinal examination of net promoter and firm revenue growth. Journal of Marketing, 71(3), 39–51. https://doi.org/10.1509/jmkg.71.3.039
Mittal, V., & Kamakura, W. A. (2001). Satisfaction, repurchase intent, and repurchase behavior: Investigating the moderating effect of customer characteristics. Journal of Marketing Research, 38(1), 131–142. https://doi.org/10.1509/jmkr.38.1.131.18832
Mittal, V., Ross, W. T., Jr., & Baldasare, P. M. (1998). The asymmetric impact of negative and positive attribute-level performance on overall satisfaction and repurchase intentions. Journal of Marketing, 62(1), 33–47. https://doi.org/10.1177/002224299806200104
Morgan, N. A., & Rego, L. L. (2006). The value of different customer satisfaction and loyalty metrics in predicting business performance. Marketing Science, 25(5), 426–439. https://doi.org/10.1287/mksc.1050.0180
Oliver, R. L. (1980). A cognitive model of the antecedents and consequences of satisfaction decisions. Journal of Marketing Research, 17(4), 460–469. https://doi.org/10.1177/002224378001700405
Parasuraman, A., Zeithaml, V. A., & Berry, L. L. (1988). SERVQUAL: A multiple-item scale for measuring consumer perceptions of service quality. Journal of Retailing, 64(1), 12–40.
Peterson, R. A., & Wilson, W. R. (1992). Measuring customer satisfaction: Fact and artifact. Journal of the Academy of Marketing Science, 20(1), 61–71. https://doi.org/10.1007/BF02723476
Reichheld, F. F. (2003). The one number you need to grow. Harvard Business Review, 81(12), 46–54.
Szymanski, D. M., & Henard, D. H. (2001). Customer satisfaction: A meta-analysis of the empirical evidence. Journal of the Academy of Marketing Science, 29(1), 16–35. https://doi.org/10.1177/0092070301291002
Van Ryzin, G. G. (2004). Expectations, performance, and citizen satisfaction with urban services. Journal of Policy Analysis and Management, 23(3), 433–448. https://doi.org/10.1002/pam.20020
Ye, C., Fulton, J., & Tourangeau, R. (2011). More positive or more extreme? A meta-analysis of mode differences in response choice. Public Opinion Quarterly, 75(2), 349–365. https://doi.org/10.1093/poq/nfr009