
Surveys · Types and applications
Customer Effort Score and the Measurement of Service Friction
The Customer Effort Score asks customers how easy it was to get what they needed. This article explains where the measure came from, how it is asked, what the evidence says about its link with loyalty and how to use it well.
Many customer surveys ask how satisfied customers are or whether they would recommend a company. The Customer Effort Score (CES) asks a different question: how easy was it to get what you needed? It focuses on service friction, the obstacles customers meet when they try to buy, get help or resolve a problem, such as repeated calls, transfers between departments and having to explain the same issue twice.
Origins
The measure was introduced by Dixon et al. (2010), who argued that companies spent too much effort trying to delight customers and too little removing the hassles that drive them away. Their research with customer service organisations suggested that exceeding expectations did little to increase loyalty, while making customers work hard to resolve problems strongly increased the chance that they would leave. They later developed the argument at book length (Dixon et al., 2013). The idea fits earlier research on service convenience, which showed that customers value the time and effort a service saves them (Berry et al., 2002).
How it is asked
The original version asked, "How much effort did you personally have to put forth to handle your request?" on a five-point scale from very low to very high effort. Because some respondents found the wording confusing and the direction of the scale counterintuitive, a later version asks customers to agree or disagree with the statement "The company made it easy for me to handle my issue." Many organisations now use a simple question such as "How easy was it to resolve your issue today?" with a fully labelled scale from "very difficult" to "very easy".
CES is usually asked straight after a specific interaction, such as a call to a help line or an online return, while the experience is fresh. It is a transactional measure, intended to diagnose particular processes rather than to summarise the whole relationship.
Evidence
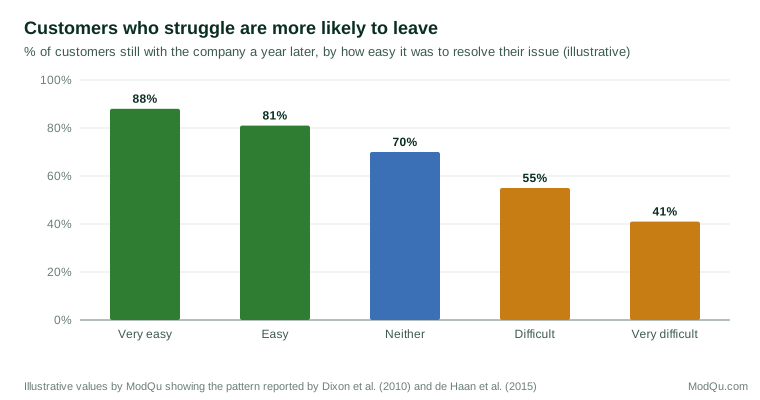
Dixon et al. (2010) reported that effort was a stronger predictor of customers' intention to buy again and to spend more than satisfaction was. These findings came from the authors' own research and were not published in peer-reviewed form. Independent evidence is more limited. de Haan et al. (2015) compared several customer feedback metrics, including satisfaction, the Net Promoter Score and a customer effort measure, for predicting whether customers stayed with their providers. Earlier, Morgan and Rego (2006) had shown that different customer metrics vary in how well they predict business performance. de Haan et al. found that the metrics differed in predictive power between industries and that no single metric was best everywhere; combining metrics improved prediction. Figure 1 illustrates the kind of relationship between effort and retention that companies commonly observe.
Using CES well
The value of CES lies less in the score itself than in what it reveals about processes. Practical points include:
- Link answers to the interaction. Matching each answer to the channel, the reason for contact and whether the issue was resolved shows where friction arises.
- Ask why. An open follow-up question, such as "What made this difficult?", identifies specific problems.
- Combine with other measures. Effort, satisfaction and recommendation capture different aspects of experience, and together they predict loyalty better than any one alone (de Haan et al., 2015). Satisfaction, for example, has a well-documented link with profitability (Anderson et al., 1994).
- Watch for selection. Customers who give up before resolving an issue may never receive the survey, so the hardest experiences can be missing.
- Track over time. Changes in the share of customers reporting difficulty, by process, show whether improvements are working.
An example
An internet provider adds an effort question to its post-call survey. Answers show that customers who contacted the company about billing found it much harder to resolve their issues than those calling about technical faults, mainly because billing calls were often transferred. The company trains first-line staff to handle common billing questions. Over six months, the share of billing callers reporting difficulty falls from 34 to 19 per cent (illustrative example).
Conclusion
The Customer Effort Score turns attention from delighting customers to removing the obstacles that frustrate them. It is easy to ask and easy to link to specific processes, which makes it useful for improving service. The evidence that it predicts loyalty better than other measures is limited, and it works best alongside satisfaction and recommendation measures rather than in place of them.
References
Anderson, E. W., Fornell, C., & Lehmann, D. R. (1994). Customer satisfaction, market share, and profitability: Findings from Sweden. Journal of Marketing, 58(3), 53–66. https://doi.org/10.1177/002224299405800304
Berry, L. L., Seiders, K., & Grewal, D. (2002). Understanding service convenience. Journal of Marketing, 66(3), 1–17. https://doi.org/10.1509/jmkg.66.3.1.18505
de Haan, E., Verhoef, P. C., & Wiesel, T. (2015). The predictive ability of different customer feedback metrics for retention. International Journal of Research in Marketing, 32(2), 195–206. https://doi.org/10.1016/j.ijresmar.2015.02.004
Dixon, M., Freeman, K., & Toman, N. (2010). Stop trying to delight your customers. Harvard Business Review, 88(7/8), 116–122.
Dixon, M., Toman, N., & DeLisi, R. (2013). The effortless experience: Conquering the new battleground for customer loyalty. Portfolio/Penguin.
Morgan, N. A., & Rego, L. L. (2006). The value of different customer satisfaction and loyalty metrics in predicting business performance. Marketing Science, 25(5), 426–439. https://doi.org/10.1287/mksc.1050.0180