
Surveys · Types and applications
Brand Awareness and Brand Tracking Surveys
Brand tracking surveys measure how many people know a brand, what they think of it and whether they buy it, repeated over time. This article explains the main measures, the theory behind them, how tracking studies are designed and how to read their results without being misled by noise.
Companies spend large sums on advertising and other marketing activity, and they want to know whether it is working. Sales figures show the end result but are affected by many factors, from prices to the weather. Brand tracking surveys measure the steps in between: whether people know a brand, what they associate with it, whether they would consider buying it and whether they have bought it recently. Repeated at regular intervals, they show how these measures change in response to marketing activity and to competitors.
This article explains the main brand measures, the theory behind them, how tracking studies are designed and the pitfalls in interpreting them.
Brand awareness
Brand awareness is the most basic brand measure: whether people know that a brand exists. It is usually measured in two or three ways (Aaker, 1991; Keller, 1993):
- Unaided or spontaneous awareness. Respondents are asked to name all the brands they can think of in a category, such as "Which brands of coffee can you think of?", without any prompting.
- Top-of-mind awareness. The first brand named in the unaided question.
- Aided or prompted awareness. Respondents are shown or read a list of brands and asked which they have heard of.
Aided awareness is always higher than unaided awareness, because recognising a name is easier than recalling it. Keller (1993) described these as brand recognition and brand recall, and argued that recall matters more when people choose brands from memory, while recognition matters more when they choose in a shop with the brands in front of them. Laurent et al. (1995) examined the relationship between the three measures across many brands and found that they followed a regular pattern: brands with higher aided awareness had higher unaided and top-of-mind awareness in a predictable way, so that the measures largely reflected a single underlying dimension.
Awareness influences choice. Hoyer and Brown (1990) found in an experiment that consumers who were aware of only one brand in a set tended to choose it even when other brands were of higher quality, and that awareness made them less likely to sample alternatives. Macdonald and Sharp (2000) replicated the finding.
Brand associations and image
Beyond awareness, tracking studies measure what people think of brands. Respondents are typically shown a list of statements, such as "good value for money" or "a brand I trust", and asked which brands they associate with each. These brand image or association measures aim to capture the brand knowledge that Keller (1993) identified as the basis of customer-based brand equity.
Interpreting these measures requires care. A well-established finding is that brand image scores largely reflect how many people use a brand. Bird et al. (1970) showed that users of a brand were much more likely to associate positive attributes with it than non-users, so that larger brands score higher on almost every attribute. Romaniuk et al. (2012) confirmed that this pattern still held forty years later. Barwise and Ehrenberg (1985) found that beliefs about brands were closely linked to usage. As a result, raw image scores mainly show brand size; to learn what is distinctive about a brand, analysts compare its scores with what would be expected given its number of users.
Brand attitudes measured in surveys are also less stable at the individual level than aggregate results suggest. Castleberry et al. (1994) and Dall'Olmo Riley et al. (1997) asked the same people about their brand beliefs on two occasions and found that only about half gave the same answer both times, even though aggregate percentages were stable. Individual-level changes in tracking data should therefore not be overinterpreted.
Brand salience and mental availability
An influential view holds that the most important brand measure is not attitude but salience: the likelihood that a brand comes to mind in buying situations. Romaniuk and Sharp (2004) defined brand salience as the propensity of a brand to be noticed or thought of in buying situations and proposed measuring it through the number and range of associations between the brand and category entry points, the needs and occasions that lead people to buy in a category. Sharp (2010) argued that brands grow mainly by increasing their mental availability and physical availability to all buyers in a category, not by building deep loyalty among a few.
This view links to the double jeopardy pattern: smaller brands have fewer buyers and those buyers are also slightly less loyal (Ehrenberg et al., 1990). Tracking studies that measure the reach of a brand's associations across all category buyers, rather than only its image among its own users, fit this framework.
Advertising awareness
Most trackers also ask whether respondents have seen or heard advertising for each brand recently, and sometimes show stills or short clips from specific campaigns. Advertising awareness is the measure most directly linked to marketing activity, and it usually responds faster to spending than brand awareness does. Brown (1985) used continuous tracking data to show that advertising awareness rose with television spending and decayed when advertising stopped, at rates that differed between campaigns. Claimed advertising awareness has known weaknesses: people attribute advertisements to the wrong brand, especially to the market leader, and report seeing advertising for well-known brands that did not advertise in the period. Prompted recognition of actual campaign material, with the brand name hidden, gives a more accurate measure of whether people saw and correctly attributed the advertising.
Consideration and purchase measures
Questions about which brands respondents would consider, which they have bought and how often they buy them link brand perceptions to behaviour. Claimed purchase is easier to measure than intention but is subject to memory errors and to over-reporting of well-known brands. Purchase intentions are an imperfect guide to future behaviour. Morwitz et al. (2007) reviewed when purchase intentions predict sales and found that they were more accurate for existing products than for new ones, for durable goods than for everyday items and for specific brands than for whole categories. Tracking studies should therefore treat intentions as indicators of direction rather than forecasts of volume, and where possible compare claimed purchase with sales or panel data.
The brand funnel
Many tracking studies organise measures into a funnel, from awareness through consideration and trial to regular purchase. Figure 1 shows a typical example. The funnel shows where a brand loses potential buyers: a brand with high awareness but low consideration has an image or relevance problem; one with high consideration but low purchase may have a problem with price, distribution or the product itself.
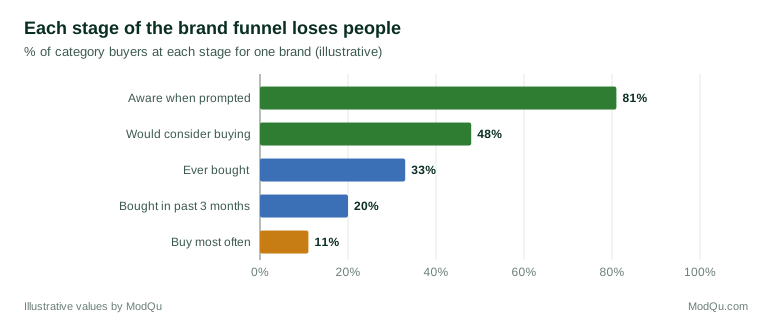
The funnel is a useful summary but a simplification. People do not necessarily move through the stages in order, and many purchases happen without deliberate consideration. Vakratsas and Ambler (1999) reviewed research on how advertising works and found little support for simple step-by-step models in which awareness leads to attitudes, which lead to purchase.
Brand equity
Several measures combine survey and market data to estimate brand equity, the value a brand adds beyond the product itself. Keller (1993) defined customer-based brand equity as the differential effect of brand knowledge on how consumers respond to marketing. Survey approaches estimate equity by comparing preferences for branded and unbranded products, or by asking about willingness to pay. Srinivasan et al. (2005) proposed a survey-based method that estimated the contribution of brand awareness, attribute perceptions and non-attribute preference to a brand's market share. Keller and Lehmann (2006) reviewed research on brands and identified measurement of brand equity as a continuing priority. Ambler (2003) argued that companies should track a small set of brand measures alongside financial results.
Designing a tracking study
Question order. Unaided awareness must be asked before any question that mentions brand names, since showing names inflates recall. Aided awareness, image and usage questions follow. The order of brands in lists should be randomised or rotated, because items near the top of a list are more likely to be chosen in self-completion surveys (Krosnick & Alwin, 1987).
Consistent methods. Tracking is about change, so questions, order, mode and sampling must remain the same from one wave to the next. Changes in method can produce apparent changes in brand measures that have nothing to do with the brand. When a method must change, both versions should be run in parallel for a period so that the effect of the change can be measured.
Sampling. Samples should represent the relevant market, usually category buyers. Most tracking studies today use online panels with quotas on age, sex and region. Composition must be controlled carefully, because changes in the mix of respondents, such as more heavy category buyers in one wave, change brand results.
Continuous or periodic. Some trackers interview in waves, for example each quarter; others interview a fixed number of people every week. Continuous tracking shows the timing of changes more precisely and makes it easier to relate them to advertising, but each week's sample is small (Brown, 1985).
Noise and signal
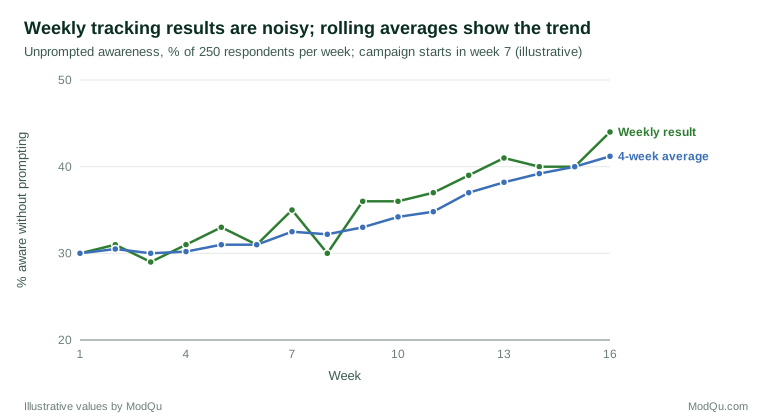
The main pitfall in interpreting tracking data is mistaking sampling noise for real change. With 250 respondents per week, the margin of error for a measure of around 30 per cent is about six percentage points. Week-to-week movements of this size occur by chance alone. Figure 2 shows how weekly results bounce around while a rolling average reveals the underlying trend.
Good practice includes reporting rolling averages, showing margins of error, using statistical tests or control charts to judge whether changes are real and avoiding conclusions from single waves. With the large samples needed to detect small changes, tracking studies are expensive, so their design should start with the size of change that matters to the business (Kish, 1965).
Tracking with online panels
Most brand trackers now use online panels, which make frequent, low-cost interviewing possible. They also introduce risks. The composition of a panel can change over time as members join and leave, and a supplier may blend in sample from other sources when its own panel cannot fill quotas. Members who take part in many surveys may become more brand-aware or answer differently from occasional respondents (Hillygus et al., 2014). Changes in brand measures can therefore reflect changes in the sample rather than in the market. Good practice includes keeping the same supplier and sample sources where possible, monitoring the profile of respondents on variables beyond the quotas, such as category buying frequency, and checking data quality consistently in each wave (Callegaro et al., 2014).
Competitors and the category
A brand tracker measures a market, not a single brand. Including competitors shows whether a change is specific to one brand or affects the whole category, for example because of seasonal demand or news about the product type. Comparing a brand's measures with those expected for its size, following the double jeopardy pattern, shows whether it is performing above or below what its market share predicts (Ehrenberg et al., 1990). Tracking the category entry points, the occasions and needs that lead people to buy, shows which situations a brand is linked with and where competitors are stronger (Romaniuk & Sharp, 2004).
Linking tracking to sales
The ultimate test of brand measures is whether they relate to sales. Brown (1985) showed how continuous tracking of advertising awareness could be related to advertising spending over time. Modern practice combines tracking data with sales, media spending and pricing in statistical models to estimate the effect of marketing on both brand measures and sales. Brand measures often move slowly and respond to many influences, so showing that a particular campaign changed them requires careful design, ideally including regional or time-based experiments.
Combining surveys with other signals
Survey trackers are increasingly read alongside other data, such as search volumes for brand names, website visits, social media mentions and retail sales data. These sources are fast and cheap but measure different things: search and social data reflect the behaviour of people who are online and active, and mentions can be driven by news events or complaints rather than by brand strength. Surveys remain the main way to measure awareness and perceptions among all category buyers, including those who never search for or talk about a brand. The most useful approach treats the survey as the measure of the market as a whole and the other sources as early signals to be checked against it.
Tracking on a small budget
Smaller organisations cannot afford weekly trackers with thousands of interviews. Useful brand knowledge can still be gained from less frequent surveys, such as twice a year, with samples large enough to detect the changes that matter. A short questionnaire focused on unaided awareness, consideration, recent purchase and a few key associations, asked the same way each time, is more valuable than a long questionnaire that changes from wave to wave.
Practical guidance
- Ask unaided awareness first, before any brand names appear.
- Keep methods constant over time and test any changes in parallel.
- Interpret image scores relative to brand size.
- Use rolling averages and report margins of error.
- Focus on the measures that relate to the brand's growth, such as reach of associations among all category buyers.
- Relate tracking results to sales and marketing activity where possible.
An example
A coffee brand runs a continuous online tracker with 250 category buyers per week. After a television campaign starts in week 7, weekly unprompted awareness moves between 30 and 44 per cent. The marketing team initially reports a jump from 30 to 35 per cent in week 7 as an immediate campaign effect, but the following week falls back to 30. Using a four-week rolling average, the analysts show a steady rise from about 31 to 41 per cent over ten weeks. Image scores rise for most attributes, but in line with the growth in the number of recent buyers, so the analysts report the increase in awareness and buyers rather than a change in what people think of the brand (illustrative example).
Conclusion
Brand tracking surveys measure awareness, associations, consideration and purchase over time, providing a view of how brands are perceived between marketing activity and sales. Their value depends on careful measurement: unaided questions before prompted ones, consistent methods, representative samples and attention to sampling error. Research on brand image and attitudes shows that many brand measures reflect brand size and that individual answers are unstable. Read with these points in mind, tracking studies provide useful knowledge about how brands grow.
References
Aaker, D. A. (1991). Managing brand equity: Capitalizing on the value of a brand name. Free Press.
Ambler, T. (2003). Marketing and the bottom line: The marketing metrics to pump up cash flow (2nd ed.). FT Prentice Hall.
Barwise, T. P., & Ehrenberg, A. S. C. (1985). Consumer beliefs and brand usage. Journal of the Market Research Society, 27(2), 81–93.
Bird, M., Channon, C., & Ehrenberg, A. S. C. (1970). Brand image and brand usage. Journal of Marketing Research, 7(3), 307–314. https://doi.org/10.1177/002224377000700303
Brown, G. (1985). Tracking studies and sales effects: A UK perspective. Journal of Advertising Research, 25(1), 52–64.
Callegaro, M., Baker, R., Bethlehem, J., Göritz, A. S., Krosnick, J. A., & Lavrakas, P. J. (Eds.). (2014). Online panel research: A data quality perspective. Wiley. https://doi.org/10.1002/9781118763520
Castleberry, S. B., Barnard, N. R., Barwise, T. P., Ehrenberg, A. S. C., & Dall'Olmo Riley, F. (1994). Individual attitude variations over time. Journal of Marketing Management, 10(1–3), 153–162. https://doi.org/10.1080/0267257X.1994.9964265
Dall'Olmo Riley, F., Ehrenberg, A. S. C., Castleberry, S. B., Barwise, T. P., & Barnard, N. R. (1997). The variability of attitudinal repeat-rates. International Journal of Research in Marketing, 14(5), 437–450. https://doi.org/10.1016/S0167-8116(97)00025-5
Ehrenberg, A. S. C., Goodhardt, G. J., & Barwise, T. P. (1990). Double jeopardy revisited. Journal of Marketing, 54(3), 82–91. https://doi.org/10.1177/002224299005400307
Hillygus, D. S., Jackson, N., & Young, M. (2014). Professional respondents in nonprobability online panels. In M. Callegaro, R. Baker, J. Bethlehem, A. S. Göritz, J. A. Krosnick, & P. J. Lavrakas (Eds.), Online panel research: A data quality perspective (pp. 219–237). Wiley. https://doi.org/10.1002/9781118763520.ch10
Hoyer, W. D., & Brown, S. P. (1990). Effects of brand awareness on choice for a common, repeat-purchase product. Journal of Consumer Research, 17(2), 141–148. https://doi.org/10.1086/208544
Keller, K. L., & Lehmann, D. R. (2006). Brands and branding: Research findings and future priorities. Marketing Science, 25(6), 740–759. https://doi.org/10.1287/mksc.1050.0153
Keller, K. L. (1993). Conceptualizing, measuring, and managing customer-based brand equity. Journal of Marketing, 57(1), 1–22. https://doi.org/10.1177/002224299305700101
Kish, L. (1965). Survey sampling. Wiley.
Krosnick, J. A., & Alwin, D. F. (1987). An evaluation of a cognitive theory of response-order effects in survey measurement. Public Opinion Quarterly, 51(2), 201–219. https://doi.org/10.1086/269029
Laurent, G., Kapferer, J.-N., & Roussel, F. (1995). The underlying structure of brand awareness scores. Marketing Science, 14(3, Suppl.), G170–G179. https://doi.org/10.1287/mksc.14.3.G170
Macdonald, E. K., & Sharp, B. M. (2000). Brand awareness effects on consumer decision making for a common, repeat purchase product: A replication. Journal of Business Research, 48(1), 5–15. https://doi.org/10.1016/S0148-2963(98)00070-8
Morwitz, V. G., Steckel, J. H., & Gupta, A. (2007). When do purchase intentions predict sales? International Journal of Forecasting, 23(3), 347–364. https://doi.org/10.1016/j.ijforecast.2007.05.015
Romaniuk, J., & Sharp, B. (2004). Conceptualizing and measuring brand salience. Marketing Theory, 4(4), 327–342. https://doi.org/10.1177/1470593104047643
Romaniuk, J., Bogomolova, S., & Riley, F. D. (2012). Brand image and brand usage: Is a forty-year-old empirical generalization still useful? Journal of Advertising Research, 52(2), 243–251. https://doi.org/10.2501/JAR-52-2-243-251
Sharp, B. (2010). How brands grow: What marketers don't know. Oxford University Press.
Srinivasan, V., Park, C. S., & Chang, D. R. (2005). An approach to the measurement, analysis, and prediction of brand equity and its sources. Management Science, 51(9), 1433–1448. https://doi.org/10.1287/mnsc.1050.0405
Vakratsas, D., & Ambler, T. (1999). How advertising works: What do we really know? Journal of Marketing, 63(1), 26–43. https://doi.org/10.1177/002224299906300103