
Surveys · Technology and the future
Accessibility in Online Surveys: Designing for All Respondents
An online survey that some people cannot use excludes them from the knowledge it produces. This article explains why accessibility matters for survey quality, the main barriers faced by respondents with disabilities and others, the standards that apply and practical steps for designing accessible questionnaires.
A survey is meant to represent the views and experiences of a population. If some members of that population cannot complete the questionnaire, their views are missing from the results. For online surveys, one of the most common reasons people cannot take part is that the questionnaire is not accessible: it cannot be read by a screen reader, it requires precise mouse movements, its text is too small or its language is too complex.
The World Health Organization (2022) estimates that about 1.3 billion people, roughly one in six people worldwide, live with a significant disability. Many more people have temporary impairments, age-related changes in vision, hearing or dexterity, limited literacy or limited experience with technology. An inaccessible survey risks excluding a large and distinctive part of the population. This article explains why accessibility matters for survey quality, describes the main barriers and sets out practical ways to design online surveys that everyone can use.
The scale of the issue
Disability is common and becomes more common with age. The first World Report on Disability brought together evidence from many countries and showed that disabled people experience poorer health, lower educational attainment, fewer economic opportunities and higher rates of poverty than people without disabilities (World Health Organization & World Bank, 2011). Those are exactly the outcomes that many surveys aim to measure. If disabled people are under-represented because questionnaires are inaccessible, survey estimates of health, employment and income will look better than reality.
Ageing populations make the issue more pressing. As the share of older people grows, so does the share of respondents with some difficulty in seeing small text, using a touch screen precisely or following complex instructions. Designing for these respondents is not a niche concern but a requirement for representing the population as it is.
Why accessibility is a quality issue
Accessibility is often seen as a matter of fairness or legal compliance. It is both, but it is also a matter of data quality. In the language of survey error, inaccessible design produces two kinds of problem.
First, it causes nonresponse and coverage error. People who cannot use the survey do not respond, or start and then break off. If they differ from other respondents, as people with disabilities, older people and people with limited literacy often do in health, income, employment and many attitudes, the results are biased. Coverage of the online population is already uneven, with lower internet use among older and less educated people (Mohorko et al., 2013), and differences in digital skills among people who are online (Hargittai, 2010). Inaccessible design adds a further barrier.
Second, it causes measurement error. Respondents who can complete an inaccessible survey only with difficulty may misread questions, select the wrong option by mistake or give up on difficult items. Their answers are less accurate than they would be with an accessible design.
Surveys about disability, health or social inclusion are especially vulnerable. A survey on the experiences of disabled people that disabled people cannot complete will produce misleading results about the very group it is meant to study.
Who faces barriers
Accessibility concerns a wide range of people. Figure 1 summarises the main groups and the barriers they commonly meet in online surveys.
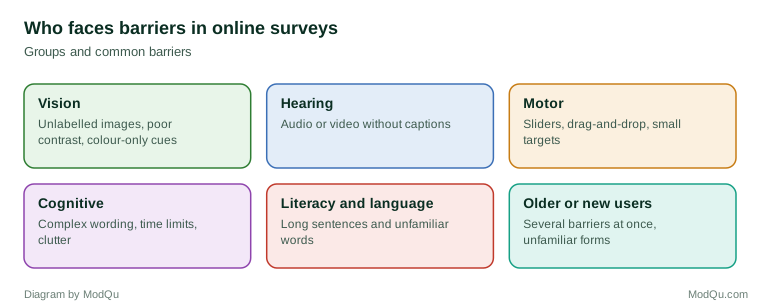
People with visual impairments may use screen readers, software that reads text aloud, or screen magnifiers. They need content that screen readers can interpret, text alternatives for images and good colour contrast. Many people have colour vision deficiencies and cannot distinguish certain colours.
People who are deaf or hard of hearing need captions or transcripts for any audio or video content.
People with motor impairments may use a keyboard instead of a mouse, or special input devices. They need questions that can be answered without precise mouse movements, such as dragging sliders or items.
People with cognitive or learning disabilities may find long or complex questions, time limits and cluttered screens difficult. Finlay and Lyons (2001) reviewed the use of self-report questionnaires with people with intellectual disabilities and found that complex wording, abstract concepts and some response formats caused particular problems, while simpler wording and fewer response options helped.
People with limited literacy or limited knowledge of the survey language need plain language and, where possible, translations or audio versions.
Older people and people with limited experience of technology often experience several of these barriers at once, together with less familiarity with online forms. Knäuper (1999) found that older respondents with less education were more affected by the order of response options, a sign of greater difficulty with the demands of answering.
Standards and law
The main international standard for accessible web content is the Web Content Accessibility Guidelines (WCAG), published by the World Wide Web Consortium (2023). WCAG is organised around four principles: content must be perceivable, operable, understandable and robust. Each principle includes specific success criteria at three levels, A, AA and AAA. Level AA is the most common target in law and organisational policy.
Many countries require accessibility for public sector websites and, increasingly, for private services. The United Nations Convention on the Rights of Persons with Disabilities requires states to promote access to information and communication technologies (United Nations, 2006). In the European Union, the European Accessibility Act sets accessibility requirements for many products and services (European Parliament & Council of the European Union, 2019). Researchers working for public bodies or in regulated sectors should check which rules apply to their surveys. Lazar et al. (2015) describe how organisations can build accessibility into their processes and policies rather than treating it as a final check.
Principles of accessible survey design
Make content perceivable
- Text alternatives. Every image that carries meaning, such as a picture of a product or a chart, needs a text description that a screen reader can read.
- Contrast and colour. Text should have enough contrast with its background, and colour should never be the only way information is conveyed. Tourangeau et al. (2007) showed that colours on response scales affect how respondents interpret them; for respondents who cannot distinguish the colours, such cues are lost or misleading, so verbal labels are essential.
- Resizable text. Respondents should be able to enlarge text without losing content or functions.
- Captions and transcripts for any audio or video.
Make the survey operable
- Keyboard access. Every question must be answerable with a keyboard alone, with a visible indication of which element is selected.
- Avoid difficult controls. Sliders, drag-and-drop ranking and other complex controls are hard or impossible for some users. Funke et al. (2011) found that sliders led to more breakoff than simple radio buttons, particularly among respondents with less formal education. Standard radio buttons, check boxes and text boxes are generally the most accessible.
- Large touch targets. On phones, answer options should be large enough to tap accurately and well separated (Antoun et al., 2018).
- No unnecessary time limits. If a time limit is essential, respondents should be able to extend it.
Make the survey understandable
- Plain language. Use short sentences, common words and one idea per question. Questions with unfamiliar terms, complex grammar and heavy memory demands are harder for everyone and especially for people with cognitive impairments or limited literacy (Graesser et al., 2006; Lenzner et al., 2010).
- Consistent layout. Present questions, buttons and instructions in the same way throughout. Respondents use visual layout to interpret questions (Couper, 2008), and inconsistent design adds confusion.
- Clear instructions and error messages. If an answer is invalid, explain what is wrong and how to fix it, in text rather than by colour alone.
- Simple response scales. Fully labelled scales with a moderate number of points are easier to understand than long numeric scales with labels only at the ends. The way scale points are labelled and arranged on screen affects answers for all respondents (Christian et al., 2009), and clear verbal labels matter most for those who cannot rely on visual cues.
Make the survey robust
- Use standard code. Surveys built with standard web elements and correct labels work with screen readers and other assistive technology. Custom controls often do not.
- Test with assistive technology. Complete the survey using a screen reader, keyboard only and screen magnification, on both computers and phones.
Grids and complex questions
Grids, in which several items share a response scale laid out in a table, are among the hardest question formats to make accessible. A screen reader user must keep track of both the row and the column, and on a small screen the grid may not fit at all. An item-by-item format, presenting each statement as a separate question, is easier to use with assistive technology and on phones. Similar care is needed with questions that require ranking, allocating points or entering complex dates.
Alternative modes and assistance
No online design will suit every respondent. Some people cannot use a computer or phone at all, and some disabilities make any self-completion difficult. Mixed-mode designs, which offer a telephone interview or paper questionnaire as an alternative, can reach people who cannot complete the online version (de Leeuw, 2005; Dillman et al., 2014). Voice input may help people who find typing difficult, although many respondents are reluctant to use it (Revilla et al., 2020).
Some respondents will need help from another person. Surveys should allow this and, where it matters for analysis, record whether the respondent had help. When another person answers entirely on the respondent's behalf, as a proxy, answers may differ from what the respondent would have said. Elliott et al. (2008) found that proxy responses about the health care experiences of older people differed systematically from self-reports. Proxy answers should be identified in the data so that analysts can take them into account.
Asking about disability
Accessible design is related to, but separate from, measuring disability in surveys. Researchers who want to analyse results by disability status need questions that identify disabled respondents consistently. The Washington Group on Disability Statistics developed a short set of six questions about difficulty with seeing, hearing, walking or climbing steps, remembering or concentrating, self-care and communicating. The questions focus on functioning rather than medical diagnoses and are designed to be comparable across countries (Madans et al., 2011). Including such questions allows researchers to check whether disabled respondents are under-represented and whether they experience more difficulty with the survey.
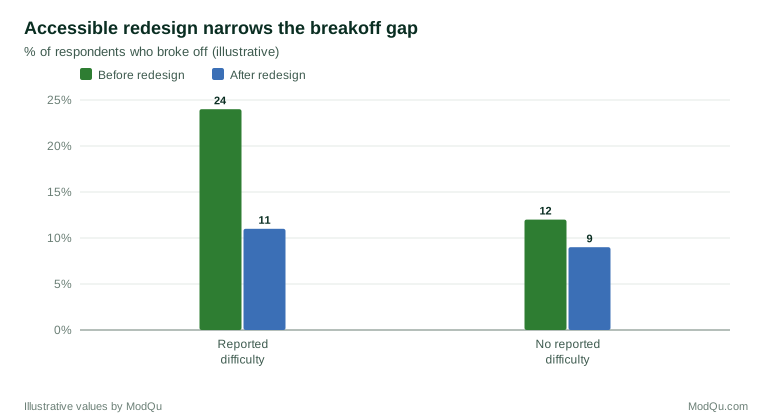
Figure 2 illustrates how breakoff can be compared between respondents with and without reported difficulties, before and after accessibility improvements.
Invitations, consent and support
Accessibility applies to the whole survey process, not only the questionnaire. Invitations sent by email or letter should use plain language and accessible formats, and the link to the survey should be easy to follow. Information about the survey and the consent statement should be as easy to understand as the questions. A long, technical consent page can be a barrier in its own right.
Some respondents with cognitive impairments may have difficulty understanding what taking part involves. Researchers should present information in simple steps, allow time and check understanding where possible. In some jurisdictions, specific legal rules govern research involving adults who may lack capacity to consent, such as the Mental Capacity Act 2005 in England and Wales. Surveys that may include such respondents need ethical review that considers these rules.
Respondents should also have a way to ask for help or an alternative format, such as a telephone number or email address shown on every page. Requests for help are themselves useful information about where the survey creates difficulties.
Testing accessibility
Accessibility should be checked throughout development, not only at the end:
- Automated checks. Free and commercial tools scan pages for common problems, such as missing labels and poor contrast. They find only some issues and cannot judge whether content makes sense.
- Manual expert review. Someone familiar with WCAG reviews each question type and page.
- Assistive technology testing. Testers complete the survey with screen readers, keyboard only and magnification.
- Testing with users. People with disabilities complete the survey and describe any problems. This is the only way to find many real-world barriers, and it extends the familiar practice of pretesting questionnaires with members of the target population.
- Monitoring. During fieldwork, compare breakoff and item nonresponse for different groups and devices, and look for questions where breakoff is concentrated.
Choosing a survey platform
Survey platforms differ greatly in accessibility. Some meet WCAG criteria for their standard question types; others do not, or only for some formats. Before choosing a platform, researchers should ask for its accessibility statement, check which question types are accessible and test a sample questionnaire with assistive technology. Customisations, such as special themes or scripts, can break accessibility even on a platform that is accessible by default.
Benefits for everyone
Accessible design benefits all respondents, not only those with disabilities. Plain language reduces misunderstanding for everyone. Large, clear answer buttons help anyone using a phone. Good contrast helps people answering in bright sunlight. Simple layouts reduce burden and breakoff for all. Survey methodologists have long recommended many of these practices for reasons of data quality alone (Dillman et al., 2014; Couper, 2008).
An example
A regional health authority runs an online survey on access to health services. In the first year, a review finds that the survey uses sliders for satisfaction ratings, colour alone to indicate required questions and a large grid of 15 items. Respondents who report difficulty seeing or remembering break off at twice the rate of others, and screen reader users cannot complete the grid at all.
For the second year, the authority replaces sliders with labelled radio buttons, adds text to required-question warnings, splits the grid into separate questions and tests the survey with a group of disabled residents, who identify further problems with error messages. It also offers a telephone option and adds the Washington Group questions. Breakoff among respondents reporting difficulties falls from 24 to 11 per cent, and the share of respondents reporting a disability rises closer to the figure from the national census (illustrative example).
Conclusion
Accessibility is a condition for representative survey knowledge. An online survey that some people cannot read, navigate or understand excludes them from the results, introducing bias that weighting cannot fully correct. Following established accessibility standards, using plain language and simple controls, offering alternative modes and testing with assistive technology and with disabled people all help ensure that a survey can hear from everyone it is meant to represent. Most of these practices also improve the experience and data quality for all respondents.
References
Antoun, C., Katz, J., Argueta, J., & Wang, L. (2018). Design heuristics for effective smartphone questionnaires. Social Science Computer Review, 36(5), 557–574. https://doi.org/10.1177/0894439317727072
Christian, L. M., Parsons, N. L., & Dillman, D. A. (2009). Designing scalar questions for web surveys. Sociological Methods & Research, 37(3), 393–425. https://doi.org/10.1177/0049124108330004
Couper, M. P. (2008). Designing effective web surveys. Cambridge University Press. https://doi.org/10.1017/CBO9780511499371
de Leeuw, E. D. (2005). To mix or not to mix data collection modes in surveys. Journal of Official Statistics, 21(2), 233–255.
Dillman, D. A., Smyth, J. D., & Christian, L. M. (2014). Internet, phone, mail, and mixed-mode surveys: The tailored design method (4th ed.). Wiley.
Elliott, M. N., Beckett, M. K., Chong, K., Hambarsoomians, K., & Hays, R. D. (2008). How do proxy responses and proxy-assisted responses differ from what Medicare beneficiaries might have reported about their health care? Health Services Research, 43(3), 833–848. https://doi.org/10.1111/j.1475-6773.2007.00820.x
European Parliament & Council of the European Union. (2019). Directive (EU) 2019/882 of the European Parliament and of the Council of 17 April 2019 on the accessibility requirements for products and services. Official Journal of the European Union, L 151, 70–115.
Finlay, W. M. L., & Lyons, E. (2001). Methodological issues in interviewing and using self-report questionnaires with people with mental retardation. Psychological Assessment, 13(3), 319–335. https://doi.org/10.1037/1040-3590.13.3.319
Funke, F., Reips, U.-D., & Thomas, R. K. (2011). Sliders for the smart: Type of rating scale on the web interacts with educational level. Social Science Computer Review, 29(2), 221–231. https://doi.org/10.1177/0894439310376896
Graesser, A. C., Cai, Z., Louwerse, M. M., & Daniel, F. (2006). Question Understanding Aid (QUAID): A web facility that tests question comprehensibility. Public Opinion Quarterly, 70(1), 3–22. https://doi.org/10.1093/poq/nfj012
Hargittai, E. (2010). Digital na(t)ives? Variation in internet skills and uses among members of the "net generation". Sociological Inquiry, 80(1), 92–113. https://doi.org/10.1111/j.1475-682X.2009.00317.x
Knäuper, B. (1999). The impact of age and education on response order effects in attitude measurement. Public Opinion Quarterly, 63(3), 347–370. https://doi.org/10.1086/297724
Lazar, J., Goldstein, D. F., & Taylor, A. (2015). Ensuring digital accessibility through process and policy. Morgan Kaufmann.
Lenzner, T., Kaczmirek, L., & Lenzner, A. (2010). Cognitive burden of survey questions and response times: A psycholinguistic experiment. Applied Cognitive Psychology, 24(7), 1003–1020. https://doi.org/10.1002/acp.1602
Madans, J. H., Loeb, M. E., & Altman, B. M. (2011). Measuring disability and monitoring the UN Convention on the Rights of Persons with Disabilities: The work of the Washington Group on Disability Statistics. BMC Public Health, 11(Suppl. 4), Article S4. https://doi.org/10.1186/1471-2458-11-S4-S4
Mental Capacity Act 2005, c. 9 (UK).
Mohorko, A., de Leeuw, E., & Hox, J. (2013). Internet coverage and coverage bias in Europe: Developments across countries and over time. Journal of Official Statistics, 29(4), 609–622. https://doi.org/10.2478/jos-2013-0042
Revilla, M., Couper, M. P., Bosch, O. J., & Asensio, M. (2020). Testing the use of voice input in a smartphone web survey. Social Science Computer Review, 38(2), 207–224. https://doi.org/10.1177/0894439318810715
Tourangeau, R., Couper, M. P., & Conrad, F. (2007). Color, labels, and interpretive heuristics for response scales. Public Opinion Quarterly, 71(1), 91–112. https://doi.org/10.1093/poq/nfl046
United Nations. (2006). Convention on the rights of persons with disabilities. United Nations.
World Health Organization & World Bank. (2011). World report on disability. World Health Organization.
World Health Organization. (2022). Global report on health equity for persons with disabilities. World Health Organization.
World Wide Web Consortium. (2023). Web Content Accessibility Guidelines (WCAG) 2.2 (W3C Recommendation). https://www.w3.org/TR/WCAG22/