
Statistics · Data science and machine learning
Sentiment Analysis: Methods and Accuracy
How sentiment analysis classifies opinions in reviews, comments and survey answers, how lexicon, machine learning and language model methods compare, and how to measure and correct their accuracy.
Every day customers write reviews, post comments and answer open-ended survey questions that express how they feel about products, services and brands. Sentiment analysis, also called opinion mining, is the set of methods that classify such text as positive, negative or neutral, or score it on a scale. It has become a routine part of customer experience programmes, brand tracking and voice of the customer reporting, because it promises to summarise thousands of comments in a single number.
That number is only as good as the classifier behind it. This article explains the main families of methods, how accuracy should be measured, why it varies, and how classification errors affect the aggregate figures that businesses report.
What sentiment analysis measures
Sentiment can be analysed at several levels (Liu, 2015; Pang & Lee, 2008):
- Document level: the overall opinion of a whole review or response.
- Sentence level: the opinion in each sentence, which matters because a single comment can praise one thing and criticise another.
- Aspect level: the opinion about each feature or attribute mentioned, such as price, staff or delivery. Hu and Liu (2004) showed how product reviews can be mined for the features customers mention and summarised by the share of positive and negative opinions about each.
The output can also take several forms. Polarity is a category (positive, negative, neutral). Intensity is a score, for example from −1 to +1. Emotion detection assigns categories such as anger, joy or fear. A hotel chain that wants to know whether complaints are about rooms or staff needs aspect-level analysis; a document-level score will hide the answer.
Methods
Lexicon and rule-based methods
The oldest approach uses a sentiment lexicon: a list of words with a positive or negative score. The sentiment of a text is calculated from the scores of the words it contains. Turney (2002) inferred the orientation of phrases from how often they appeared near the words "excellent" and "poor" on the web, and classified 410 reviews with an average accuracy of 74%, ranging from 84% for car reviews to 66% for film reviews. Film reviews were hard because reviewers often describe unpleasant events in films they like.
Modern lexicons add rules for negation ("not good"), intensifiers ("very good") and contrast ("good, but"). Taboada et al. (2011) showed that a carefully built lexicon with such rules performs consistently across different kinds of text. VADER, a rule-based tool designed for social media, also handles capitals, exclamation marks and emoticons; in its authors' evaluation on social media posts it matched or exceeded the accuracy of individual human raters (Hutto & Gilbert, 2014). Emotion lexicons extend the idea beyond polarity; the NRC lexicon, built by crowdsourcing, links around 14,000 English words to eight basic emotions as well as to positive and negative sentiment (Mohammad & Turney, 2013).
Lexicons are transparent and need no training data, but they struggle with context. Wilson et al. (2005) showed that a word's prior polarity, the sentiment it carries out of context, often differs from its polarity in a particular phrase. "Unpredictable" is negative for a car's steering and positive for a film's plot. A lexicon built for one domain can perform poorly in another.
Supervised machine learning
Supervised methods learn from examples. A set of texts is labelled by people, each text is represented as features (usually word counts or tf-idf weights), and a classifier such as naive Bayes, logistic regression or a support vector machine learns which features predict which label. In the study that launched the field, Pang et al. (2002) applied this approach to film reviews and found that machine learning classifiers clearly outperformed word lists chosen by people. They also found sentiment harder to classify than topic, because sentiment is often expressed subtly.
Supervised methods adapt to the domain they are trained on, but they need labelled data from that domain, and their accuracy falls when they are applied to text unlike their training set.
Deep learning and pre-trained language models
Neural networks learn representations of words and sentences rather than relying on hand-built features. Maas et al. (2011) learned word vectors that capture sentiment and released a corpus of 50,000 film reviews that became a standard benchmark. Socher et al. (2013) built a treebank in which every phrase of every sentence was labelled, allowing models to learn how sentiment combines, for example how negation reverses it. Their results also showed how much harder fine-grained classification is: accuracy for a simple positive-versus-negative split was around 85%, but for five classes from very negative to very positive it was below 50%.
Pre-trained transformer models such as BERT changed practice again. They are trained on very large amounts of general text and then fine-tuned on a few thousand labelled examples for a specific task (Devlin et al., 2019). Because they represent each word in the context of the whole sentence, they handle negation, contrast and informal language much better than word counts.
Large generative language models can also be asked directly, in plain language, to classify a comment's sentiment, without any task-specific training. This "zero-shot" use is convenient, but its accuracy must be checked in exactly the same way as any other method, and results can change when the model version or the wording of the instruction changes.
Which method is most accurate?
Comparative studies give a consistent message. Ribeiro et al. (2016) compared 24 popular sentence-level methods on 18 labelled datasets and found that no method was best everywhere; performance varied widely between datasets, and some popular tools performed poorly on some kinds of text. Hartmann et al. (2019) compared ten text classification methods across 41 social media datasets and found that supervised machine learning methods generally outperformed lexicon-based approaches. In a later comparison, Hartmann et al. (2023) found that fine-tuned transfer learning models were more accurate than lexicons and traditional machine learning across a wide range of datasets, and showed that inaccurate sentiment measurement can distort the conclusions drawn from it.
The practical lesson is that published accuracy figures describe a method on a particular dataset. They are not a property of the method itself.
Measuring accuracy
Accuracy should be measured on a test set: a random sample of texts from the data being analysed, labelled by trained people and never used to train or tune the method. The comparison between human labels and model labels is summarised in a confusion matrix.
A worked example
Suppose a hypothetical hotel group has 1,000 comments from a guest survey labelled by two trained coders, who resolved their disagreements. A fine-tuned classifier's labels are compared with theirs:
| Human label | Model: positive | Model: neutral | Model: negative | Total |
|---|---|---|---|---|
| Positive | 440 | 40 | 20 | 500 |
| Neutral | 50 | 110 | 40 | 200 |
| Negative | 20 | 30 | 250 | 300 |
| Total | 510 | 180 | 310 | 1,000 |
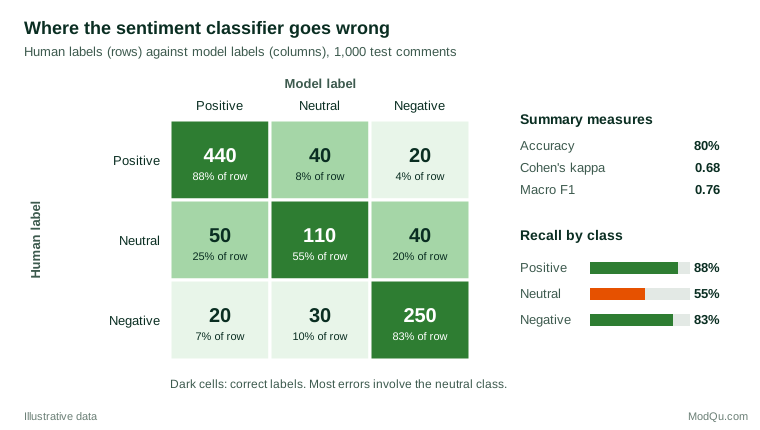
Accuracy, the share of comments labelled correctly, is (440 + 110 + 250) ÷ 1,000 = 80%. This looks good, but accuracy depends on the class mix: a useless model that labels everything positive would score 50% here, and much more in a dataset where 90% of comments are positive.
Precision and recall describe each class separately (Sokolova & Lapalme, 2009). Precision is the share of comments the model calls negative that really are negative; recall is the share of truly negative comments the model finds:
precision = TP ÷ (TP + FP) recall = TP ÷ (TP + FN) F1 = 2 × precision × recall ÷ (precision + recall)
Here TP, FP and FN are the true positives, false positives and false negatives for the class in question. For the negative class, precision is 250 ÷ 310 = 81% and recall is 250 ÷ 300 = 83%. For the neutral class, both are much lower: precision 61% and recall 55%. The macro-averaged F1, the simple mean of the three class F1 scores, is 0.76. Reporting it alongside accuracy prevents a strong majority class from hiding a weak minority class.
Cohen's kappa corrects agreement for chance (Cohen, 1960):
κ = (po − pe) ÷ (1 − pe)
where po is observed agreement and pe is the agreement expected if model and humans labelled independently with their own class frequencies. Here po = 0.80 and pe = 0.384, so κ = 0.68, which Landis and Koch (1977) would describe as substantial agreement.
The human ceiling
Human labels are themselves imperfect. Sentiment involves judgement, and trained annotators disagree, especially about neutral, mixed and sarcastic texts. Wiebe et al. (2005) developed a detailed scheme for annotating opinions and emotions in news text and measured agreement between annotators, finding it good but well short of perfect. A model's agreement with one coder cannot meaningfully exceed the agreement between two coders, so inter-rater reliability should always be reported as the benchmark. If two people agree on only 75% of comments, a model that agrees with either of them on 78% is performing about as well as a person.
Why accuracy varies
- Domain. Words carry different sentiment in different settings, and methods trained on film reviews or social media often perform worse on survey comments about banking or healthcare.
- The neutral class. Many comments are factual, mixed or ambivalent. Neutral is usually the hardest class to identify, as in the worked example, and two-class benchmarks that exclude it give flattering accuracy figures.
- Negation and contrast. "Not bad at all" is positive. "The room was lovely but the staff were rude" contains both polarities. Bag-of-words methods handle these poorly.
- Sarcasm and irony. Sarcasm often pairs positive words with a negative situation, as in "Love waiting an hour for a coffee", which reverses the apparent sentiment (Riloff et al., 2013).
- Short and informal text. Abbreviations, misspellings and emoji are common in comments and reviews, and many lexicons do not recognise them.
- Language and dialect. Most tools and benchmarks are strongest in English. Accuracy for other languages, and for dialects and code-switching within a language, should never be assumed.
- Bias across groups. Kiritchenko and Mohammad (2018) tested more than 200 sentiment systems on sentences that differed only in a person's name or gender and found that several consistently gave slightly higher or lower scores depending on the race or gender implied. A classifier can therefore be less accurate, or biased, for some customer groups than others.
From individual errors to aggregate figures
Businesses rarely report individual classifications. They report shares: 62% positive this quarter, net sentiment of +24, a rise of five points since last year. Hopkins and King (2010) pointed out that a classifier which is accurate for individual texts can still give biased estimates of these proportions, and that it is the proportions that social scientists and managers usually need.
The problem is easy to see for two classes. If the true share of negative comments is π, and the classifier has sensitivity Se (the share of negative comments correctly labelled negative) and specificity Sp (the share of other comments correctly labelled not negative), then the share the classifier reports is:
pobs = Se × π + (1 − Sp) × (1 − π)
Unless Se and Sp are both 1, the observed share is pulled towards the middle. Rare sentiment is overstated and common sentiment is understated, and real changes over time appear smaller than they are, because the observed share moves by only (Se + Sp − 1) points for each one-point change in the true share.
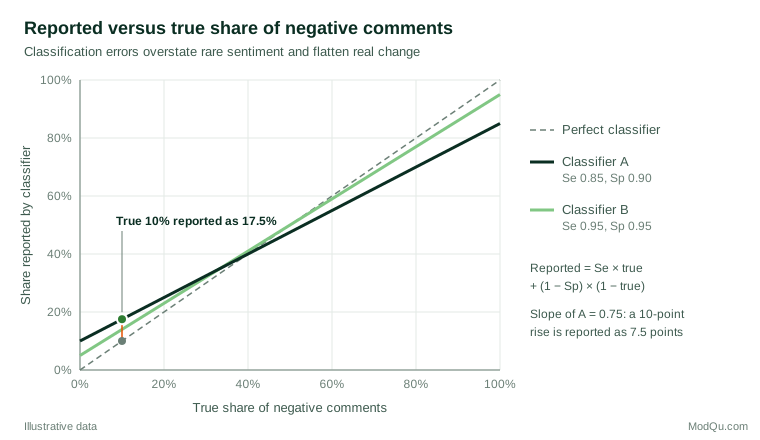
Continuing the hypothetical example, suppose Se = 0.85 and Sp = 0.90. If 10% of comments are truly negative, the classifier reports 0.85 × 0.10 + 0.10 × 0.90 = 17.5%, nearly double the true figure. If the true share rises from 10% to 20%, the reported share rises only from 17.5% to 25%. When Se and Sp have been estimated from a good test set, the reported share can be corrected:
π̂ = (pobs + Sp − 1) ÷ (Se + Sp − 1)
which recovers 10% from the observed 17.5%. The correction is only as reliable as the estimates of Se and Sp, and it assumes that error rates are the same in the data being analysed as in the test set. Errors can also partly cancel: in the worked example the model's 51% positive and 31% negative shares are close to the human 50% and 30%, even though one comment in five was misclassified. Close agreement at the aggregate level does not guarantee that comparisons between subgroups or periods will also agree, because the cancellation may not hold within each subgroup.
Practical guidance for survey and business data
- Build a local test set. Label a random sample of at least several hundred comments from your own data, with two coders and a reconciliation step. Published benchmarks are no substitute.
- Report several measures. Give accuracy, macro F1, per-class precision and recall, Cohen's kappa and the human inter-rater agreement. Report confidence intervals, since test sets are samples.
- Check accuracy by subgroup and over time. Compare performance across regions, languages, customer segments and survey waves before comparing sentiment across them.
- Match the method to the question. Use aspect-level analysis when the question is about what drives satisfaction, and treat emotion categories with caution unless they have been validated for your data.
- Correct or calibrate shares when misclassification is substantial and the reported figures will be used for decisions or trend reporting.
- Read the comments. Sample and read misclassified comments; they often reveal a missing rule, a new product name or a sarcasm pattern.
Common mistakes
- Trusting vendor accuracy claims. An accuracy figure from a different domain, language or class mix says little about performance on your data.
- Reporting accuracy alone. With unbalanced classes, high accuracy can coexist with poor detection of the minority class that matters most, often the negative comments.
- Ignoring the neutral and mixed categories. Forcing every comment into positive or negative creates errors and inflates apparent polarisation.
- Treating scores as exact. A sentiment score is an estimate with error. Small differences between brands or months may be noise or artefacts of misclassification.
- Changing tools mid-series. Switching methods or model versions can shift reported sentiment overnight. Run both in parallel before switching.
- Assuming fairness. A method that works well on average may score some groups' language systematically differently.
Key takeaways
Sentiment analysis turns large volumes of text into measures of opinion, using lexicons, supervised machine learning or pre-trained language models. Fine-tuned language models are usually the most accurate today, but no method is accurate everywhere, and accuracy on one dataset says little about another. Measure performance on a labelled sample of your own data, report class-level measures and human agreement alongside accuracy, check subgroups, and remember that classification errors bias the shares and trends that decision-makers see. Treated as a measurement instrument that must be validated, sentiment analysis is a valuable addition to survey and customer research.
References
Cohen, J. (1960). A coefficient of agreement for nominal scales. Educational and Psychological Measurement, 20(1), 37–46. https://doi.org/10.1177/001316446002000104
Devlin, J., Chang, M.-W., Lee, K., & Toutanova, K. (2019). BERT: Pre-training of deep bidirectional transformers for language understanding. In Proceedings of the 2019 Conference of the North American Chapter of the Association for Computational Linguistics: Human Language Technologies, Volume 1 (Long and Short Papers) (pp. 4171–4186). Association for Computational Linguistics. https://doi.org/10.18653/v1/N19-1423
Hartmann, J., Heitmann, M., Siebert, C., & Schamp, C. (2023). More than a feeling: Accuracy and application of sentiment analysis. International Journal of Research in Marketing, 40(1), 75–87. https://doi.org/10.1016/j.ijresmar.2022.05.005
Hartmann, J., Huppertz, J., Schamp, C., & Heitmann, M. (2019). Comparing automated text classification methods. International Journal of Research in Marketing, 36(1), 20–38. https://doi.org/10.1016/j.ijresmar.2018.09.009
Hopkins, D. J., & King, G. (2010). A method of automated nonparametric content analysis for social science. American Journal of Political Science, 54(1), 229–247. https://doi.org/10.1111/j.1540-5907.2009.00428.x
Hu, M., & Liu, B. (2004). Mining and summarizing customer reviews. In Proceedings of the Tenth ACM SIGKDD International Conference on Knowledge Discovery and Data Mining (pp. 168–177). Association for Computing Machinery. https://doi.org/10.1145/1014052.1014073
Hutto, C., & Gilbert, E. (2014). VADER: A parsimonious rule-based model for sentiment analysis of social media text. Proceedings of the International AAAI Conference on Web and Social Media, 8(1), 216–225. https://doi.org/10.1609/icwsm.v8i1.14550
Kiritchenko, S., & Mohammad, S. M. (2018). Examining gender and race bias in two hundred sentiment analysis systems. In Proceedings of the Seventh Joint Conference on Lexical and Computational Semantics (pp. 43–53). Association for Computational Linguistics. https://doi.org/10.18653/v1/S18-2005
Landis, J. R., & Koch, G. G. (1977). The measurement of observer agreement for categorical data. Biometrics, 33(1), 159–174. https://doi.org/10.2307/2529310
Liu, B. (2015). Sentiment analysis: Mining opinions, sentiments, and emotions. Cambridge University Press. https://doi.org/10.1017/CBO9781139084789
Maas, A. L., Daly, R. E., Pham, P. T., Huang, D., Ng, A. Y., & Potts, C. (2011). Learning word vectors for sentiment analysis. In Proceedings of the 49th Annual Meeting of the Association for Computational Linguistics: Human Language Technologies (pp. 142–150). Association for Computational Linguistics.
Mohammad, S. M., & Turney, P. D. (2013). Crowdsourcing a word–emotion association lexicon. Computational Intelligence, 29(3), 436–465. https://doi.org/10.1111/j.1467-8640.2012.00460.x
Pang, B., & Lee, L. (2008). Opinion mining and sentiment analysis. Foundations and Trends in Information Retrieval, 2(1–2), 1–135. https://doi.org/10.1561/1500000011
Pang, B., Lee, L., & Vaithyanathan, S. (2002). Thumbs up? Sentiment classification using machine learning techniques. In Proceedings of the 2002 Conference on Empirical Methods in Natural Language Processing (pp. 79–86). Association for Computational Linguistics. https://doi.org/10.3115/1118693.1118704
Ribeiro, F. N., Araújo, M., Gonçalves, P., Gonçalves, M. A., & Benevenuto, F. (2016). SentiBench: A benchmark comparison of state-of-the-practice sentiment analysis methods. EPJ Data Science, 5(1), Article 23. https://doi.org/10.1140/epjds/s13688-016-0085-1
Riloff, E., Qadir, A., Surve, P., De Silva, L., Gilbert, N., & Huang, R. (2013). Sarcasm as contrast between a positive sentiment and negative situation. In Proceedings of the 2013 Conference on Empirical Methods in Natural Language Processing (pp. 704–714). Association for Computational Linguistics.
Socher, R., Perelygin, A., Wu, J., Chuang, J., Manning, C. D., Ng, A., & Potts, C. (2013). Recursive deep models for semantic compositionality over a sentiment treebank. In Proceedings of the 2013 Conference on Empirical Methods in Natural Language Processing (pp. 1631–1642). Association for Computational Linguistics.
Sokolova, M., & Lapalme, G. (2009). A systematic analysis of performance measures for classification tasks. Information Processing & Management, 45(4), 427–437. https://doi.org/10.1016/j.ipm.2009.03.002
Taboada, M., Brooke, J., Tofiloski, M., Voll, K., & Stede, M. (2011). Lexicon-based methods for sentiment analysis. Computational Linguistics, 37(2), 267–307. https://doi.org/10.1162/COLI_a_00049
Turney, P. D. (2002). Thumbs up or thumbs down? Semantic orientation applied to unsupervised classification of reviews. In Proceedings of the 40th Annual Meeting of the Association for Computational Linguistics (pp. 417–424). Association for Computational Linguistics. https://doi.org/10.3115/1073083.1073153
Wiebe, J., Wilson, T., & Cardie, C. (2005). Annotating expressions of opinions and emotions in language. Language Resources and Evaluation, 39(2–3), 165–210. https://doi.org/10.1007/s10579-005-7880-9
Wilson, T., Wiebe, J., & Hoffmann, P. (2005). Recognizing contextual polarity in phrase-level sentiment analysis. In Proceedings of Human Language Technology Conference and Conference on Empirical Methods in Natural Language Processing (pp. 347–354). Association for Computational Linguistics. https://doi.org/10.3115/1220575.1220619