
Statistics · Inference
Missing Data Mechanisms and Their Implications for Knowledge Completeness
Why the reason data are missing matters more than the amount, how MCAR, MAR and MNAR differ, and which analysis choices keep survey and business conclusions trustworthy.
Almost every real data set has holes. Survey respondents skip questions or stop halfway, customers leave profile fields blank, sensors fail and records are lost when systems are merged. The instinctive response is to count the gaps and hope they are few. Statistical theory gives a sharper answer: what matters most is not how much is missing but why it is missing. The same 20% of absent values can be harmless in one study and seriously misleading in another, depending on the process that produced the gaps. That process is called the missing data mechanism, and understanding it is the first step towards knowing how complete, and how trustworthy, a body of evidence really is.
Rubin's three mechanisms
The modern framework comes from Rubin (1976), who treated missingness itself as a random variable. For each value, an indicator records whether it was observed. The mechanism is the probability model for those indicators, and Rubin showed that the validity of an analysis depends on how that probability relates to the data. Three cases are now standard (Little & Rubin, 2019).
Missing completely at random (MCAR). The probability that a value is missing does not depend on any data, observed or unobserved. A random subset of questionnaires lost in the post, or a planned design in which each respondent is randomly given only some modules, are close to MCAR. The observed cases are then a random subsample of all cases, so analyses of the complete cases are unbiased, though less precise.
Missing at random (MAR). The probability of missingness may depend on observed information but not on the missing values themselves once that information is taken into account. If younger customers are less likely to answer an income question, but within each age group the people who skip it have the same income distribution as those who answer, the income data are MAR given age. The name is easy to misread: MAR does not mean the gaps are haphazard, only that they can be explained by variables the analyst holds (Seaman et al., 2013).
Missing not at random (MNAR). The probability of missingness depends on the unobserved values, even after conditioning on everything observed. People with very high or very low incomes may refuse to report them; dissatisfied customers may be the least willing to complete a satisfaction survey. Under MNAR the observed data alone cannot identify the full distribution without extra, untestable assumptions.
Rubin (1976) also showed that under MAR, together with a technical condition that the parameters of the data model and the missingness model are distinct, the mechanism is ignorable for likelihood-based and Bayesian inference. The analyst can model the observed data correctly without modelling why values are missing. This result underpins most of the practical methods used today.
Why the mechanism determines what can be known
A simulation makes the point concrete. Imagine a hypothetical customer survey in which satisfaction scores (0 to 10) have a true mean of 6.0, and a measure of product usage, recorded for everyone from system logs, is correlated with satisfaction. Around 35% to 40% of satisfaction scores are then deleted under each of the three mechanisms.
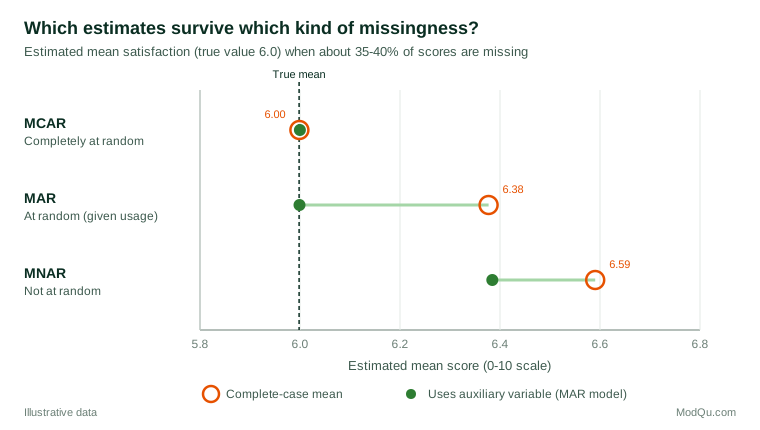
Under MCAR, the simple average of the answers that came in is correct. Under MAR, where light users are more likely to skip the question, the complete-case mean rises to about 6.38 because the answers that arrive over-represent satisfied heavy users. A model that uses the usage variable to predict the missing scores recovers the true value. Under MNAR, where dissatisfied customers themselves are more likely to stay silent, the complete-case mean is about 6.59, and even the usage-based model only gets part of the way back, to about 6.39. The amount of missing data is almost identical in all three cases; the conclusions are not.
The lesson for anyone building knowledge from incomplete data is that the response rate or completion rate alone says little about bias. A large meta-analysis of household surveys found that nonresponse rates were only weakly related to nonresponse bias across studies, while bias varied greatly between estimates within the same survey (Groves & Peytcheva, 2008). What matters is the correlation between the propensity to respond and the variable being measured (Groves, 2006).
Diagnosing the mechanism
The mechanism can never be fully verified from the observed data, because the crucial information is in the values that are absent. Analysts can, however, gather useful evidence.
- Compare respondents and nonrespondents on variables known for everyone, such as sampling frame data, customer tenure or channel. Differences rule out MCAR and suggest which variables a MAR model needs.
- Test MCAR formally. Little (1988) proposed a chi-square test that compares the means of observed variables across missing data patterns. Rejecting it rules out MCAR; failing to reject it does not prove MCAR, especially in small samples.
- Use follow-up and paradata. Intensive follow-up of a subsample of nonrespondents, or the comparison of early and late responders, can show whether hard-to-reach cases differ on the outcomes themselves.
- Use subject-matter knowledge. Questions on income, health, sensitive behaviour and dissatisfaction are classic candidates for MNAR, and the analysis plan should treat them with more caution.
Methods matched to the mechanism
Complete-case analysis
Dropping every record with a missing value, often the software default, is unbiased under MCAR and in some regression settings where missingness depends only on the covariates. Otherwise it can bias results, and it always discards information, which can shrink the sample sharply when many variables each have a few gaps (Schafer & Graham, 2002). Single imputation of the mean is worse in one respect: it keeps the sample size but artificially reduces variance and weakens correlations.
Likelihood methods
Under MAR, maximum likelihood estimation using all available data gives valid estimates without filling in values. The expectation-maximisation (EM) algorithm of Dempster et al. (1977) made such estimation practical, and full information maximum likelihood is now standard in structural equation modelling software, where it outperforms deletion methods in simulation studies (Enders & Bandalos, 2001).
Multiple imputation
Multiple imputation, developed by Rubin (1987) for survey nonresponse, fills each missing value several times with plausible draws from a predictive model, analyses each completed data set and combines the results with simple rules that carry the extra uncertainty from imputation into the final standard errors. Chained equations, which impute each variable in turn from a regression on the others, have made the approach flexible and widely available (van Buuren, 2018; White et al., 2011). The imputation model should include every variable in the analysis model, including the outcome, plus auxiliary variables that predict either the missing values or the chance of missingness (Graham, 2009).
Weighting and doubly robust estimation
In surveys, unit nonresponse is usually handled by weighting respondents by the inverse of their estimated response probability, again under a MAR assumption. Doubly robust estimators combine a response model and an outcome model and remain consistent if either is correctly specified, although Kang and Schafer (2007) showed that they can perform poorly when both models are moderately wrong.
When data are missing not at random
No method can remove MNAR bias without assumptions that the data cannot check. Two families of models make those assumptions explicit. Selection models specify the joint distribution of the outcome and the missingness, as in Heckman's (1979) sample selection model. Pattern-mixture models specify how the distribution of the outcome differs between respondents and nonrespondents (Little & Rubin, 2019). Both depend on parameters that are, in effect, chosen rather than estimated.
The recommended response is therefore sensitivity analysis: re-estimating the key results under a range of plausible departures from MAR and reporting how far conclusions move (Molenberghs & Kenward, 2007). A simple version is the delta adjustment, in which imputed values for nonrespondents are shifted by a chosen amount, for example half a point lower on a satisfaction scale, and the analysis is repeated. If the business decision would be the same across all plausible shifts, the evidence is robust; if it flips, decision-makers need to know.
Practical guidance for survey and business data
- Prevent first. Short questionnaires, good routing, clear "don't know" options and reminders reduce missingness more cheaply than any statistical repair.
- Record why data are missing. Distinguish "refused", "don't know", "not applicable" and "not asked". They imply different mechanisms and should not share one blank code.
- Collect auxiliary variables. Information known for everyone, such as frame variables, transaction history or paradata, is what makes MAR plausible and imputation effective.
- Prefer principled methods. Use multiple imputation or likelihood methods rather than deletion or mean substitution when more than a few percent of cases are affected (Sterne et al., 2009).
- Report transparently. State the amount and pattern of missing data, the assumed mechanism, the method used and the results of sensitivity analyses.
Common mistakes
- Treating a high response rate as proof that results are unbiased, or a low one as proof that they are biased.
- Assuming MAR holds simply because software methods require it, without asking whether the auxiliary variables are rich enough.
- Leaving the outcome variable out of the imputation model, which biases associations towards zero.
- Treating imputed values as if they were observed, which understates uncertainty.
Key takeaways
Missing data are not just a loss of sample size; they are a potential source of systematic error whose size depends on the mechanism that created them. Under MCAR, little harm is done. Under MAR, principled methods that use observed information can restore valid conclusions. Under MNAR, no analysis is assumption-free, and honest reporting means showing how conclusions change under plausible alternatives. Asking why data are missing, recording the answer and planning the analysis around it are what turn an incomplete data set into knowledge that can be relied on.
References
Dempster, A. P., Laird, N. M., & Rubin, D. B. (1977). Maximum likelihood from incomplete data via the EM algorithm. Journal of the Royal Statistical Society Series B: Statistical Methodology, 39(1), 1–22. https://doi.org/10.1111/j.2517-6161.1977.tb01600.x
Enders, C. K., & Bandalos, D. L. (2001). The relative performance of full information maximum likelihood estimation for missing data in structural equation models. Structural Equation Modeling: A Multidisciplinary Journal, 8(3), 430–457. https://doi.org/10.1207/S15328007SEM0803_5
Graham, J. W. (2009). Missing data analysis: Making it work in the real world. Annual Review of Psychology, 60, 549–576. https://doi.org/10.1146/annurev.psych.58.110405.085530
Groves, R. M. (2006). Nonresponse rates and nonresponse bias in household surveys. Public Opinion Quarterly, 70(5), 646–675. https://doi.org/10.1093/poq/nfl033
Groves, R. M., & Peytcheva, E. (2008). The impact of nonresponse rates on nonresponse bias: A meta-analysis. Public Opinion Quarterly, 72(2), 167–189. https://doi.org/10.1093/poq/nfn011
Heckman, J. J. (1979). Sample selection bias as a specification error. Econometrica, 47(1), 153–161. https://doi.org/10.2307/1912352
Kang, J. D. Y., & Schafer, J. L. (2007). Demystifying double robustness: A comparison of alternative strategies for estimating a population mean from incomplete data. Statistical Science, 22(4), 523–539. https://doi.org/10.1214/07-STS227
Little, R. J. A. (1988). A test of missing completely at random for multivariate data with missing values. Journal of the American Statistical Association, 83(404), 1198–1202. https://doi.org/10.1080/01621459.1988.10478722
Little, R. J. A., & Rubin, D. B. (2019). Statistical analysis with missing data (3rd ed.). Wiley. https://doi.org/10.1002/9781119482260
Molenberghs, G., & Kenward, M. G. (2007). Missing data in clinical studies. Wiley. https://doi.org/10.1002/9780470510445
Rubin, D. B. (1976). Inference and missing data. Biometrika, 63(3), 581–592. https://doi.org/10.1093/biomet/63.3.581
Rubin, D. B. (1987). Multiple imputation for nonresponse in surveys. Wiley. https://doi.org/10.1002/9780470316696
Schafer, J. L., & Graham, J. W. (2002). Missing data: Our view of the state of the art. Psychological Methods, 7(2), 147–177. https://doi.org/10.1037/1082-989X.7.2.147
Seaman, S., Galati, J., Jackson, D., & Carlin, J. (2013). What is meant by "missing at random"? Statistical Science, 28(2), 257–268. https://doi.org/10.1214/13-STS415
Sterne, J. A. C., White, I. R., Carlin, J. B., Spratt, M., Royston, P., Kenward, M. G., Wood, A. M., & Carpenter, J. R. (2009). Multiple imputation for missing data in epidemiological and clinical research: Potential and pitfalls. BMJ, 338, Article b2393. https://doi.org/10.1136/bmj.b2393
van Buuren, S. (2018). Flexible imputation of missing data (2nd ed.). Chapman and Hall/CRC. https://doi.org/10.1201/9780429492259
White, I. R., Royston, P., & Wood, A. M. (2011). Multiple imputation using chained equations: Issues and guidance for practice. Statistics in Medicine, 30(4), 377–399. https://doi.org/10.1002/sim.4067