
Statistics · Tests and models
Driver Analysis: Identifying What Influences Satisfaction
How driver analysis estimates which service attributes matter most for overall satisfaction, why ordinary regression weights mislead, and how to turn importance into sound priorities.
Customer surveys usually ask for an overall rating, such as satisfaction or likelihood to recommend, followed by ratings of specific attributes: product quality, price, staff, delivery and so on. Managers then want to know which attributes matter most, so that limited budgets go where they will make the biggest difference. Driver analysis, also called key driver analysis, is the family of statistical methods used to answer that question. It estimates the importance of each attribute from the way attribute ratings relate to the overall rating across respondents.
Stated and derived importance
There are two broad ways to measure importance. Stated importance simply asks respondents how important each attribute is. It is easy to collect but tends to produce answers where everything is "very important", and people are not always good at reporting what actually shapes their judgements. Derived importance infers importance statistically from the survey data: an attribute is important if customers who rate it highly also tend to give high overall ratings. Most driver analysis uses derived importance, sometimes alongside stated importance as a check. When the two disagree, the gap is itself informative: an attribute that customers call essential but that barely relates to their ratings may be a basic expectation that is already being met.
Why the obvious methods mislead
The simplest derived measure is the correlation between each attribute and overall satisfaction. Its weakness is that attribute ratings are almost always correlated with one another. Customers who are happy overall tend to rate everything higher, a halo effect that can make every attribute look important.
The next step is multiple regression, which estimates each attribute's effect while holding the others constant. In principle this separates overlapping influences, but standardised regression coefficients are a poor guide to importance when predictors are strongly correlated (Darlington, 1968). Small changes in the sample can shift weight from one attribute to another, and an attribute that clearly relates to satisfaction can receive a coefficient near zero, or even a negative one, simply because a correlated attribute has absorbed its share.
Table 1 shows an illustrative example from 800 hypothetical customers rating six attributes on a 10-point scale. The model explains 53% of the variance in overall satisfaction (R² = 0.53).
| Attribute | Correlation with overall | Standardised coefficient | Relative weight (share of R²) |
|---|---|---|---|
| Product quality | 0.58 | 0.35 | 33% |
| Price and value | 0.47 | 0.23 | 19% |
| Staff helpfulness | 0.54 | 0.19 | 16% |
| Delivery speed | 0.40 | 0.16 | 12% |
| Website ease | 0.37 | 0.09 | 8% |
| Returns process | 0.46 | 0.03 | 11% |
The returns process correlates 0.46 with overall satisfaction, yet its regression coefficient is almost zero. The reason is that its ratings correlate 0.85 with staff helpfulness: customers judge both largely through their contact with staff. Regression assigns the shared variance to staff helpfulness, and a manager reading the coefficients would conclude that returns do not matter at all. That conclusion is an artefact of the overlap, not a finding about customers.
Relative importance methods
Relative importance methods were designed for this problem. They divide the model's R² among the predictors in a way that accounts for both each attribute's unique contribution and the variance it shares with others (Johnson & LeBreton, 2004). The resulting weights are non-negative and add up to R², so they can be expressed as percentages of the explained variance.
- Dominance analysis and Shapley value regression. Budescu (1993) proposed comparing each attribute's contribution to R² across all possible subsets of the other attributes. Averaging the increase in R² over every order in which attributes could enter the model gives the same decomposition, an idea discussed by Kruskal (1987) and known in marketing as Shapley value regression, after the game-theory solution it mirrors (Lipovetsky & Conklin, 2001). Azen and Budescu (2003) extended dominance analysis to show when one predictor is more important than another in every subset model. The method is exact but the number of subsets doubles with each attribute, which becomes slow with many attributes.
- Relative weights. Johnson (2000) proposed a fast approximation that transforms the attributes into uncorrelated variables, regresses satisfaction on them, and maps the results back to the original attributes. Relative weights agree closely with dominance analysis in practice and handle dozens of attributes easily.
Grömping (2007) compares these and other variance-decomposition estimators and explains the properties each satisfies. In the example, relative weights give the returns process 11% of the explained variance, close to its Shapley share, rather than the near-zero share implied by the regression coefficient. Tonidandel and LeBreton (2011) recommend reporting such weights alongside the regression results, with bootstrap confidence intervals to show how precisely each weight is estimated.
From importance to priorities
Importance alone does not tell a manager where to act. An attribute can be important but already performing well, or performing poorly but of little consequence. The importance-performance map, introduced by Martilla and James (1977), plots each attribute's importance against its performance, often split into four quadrants at the averages.
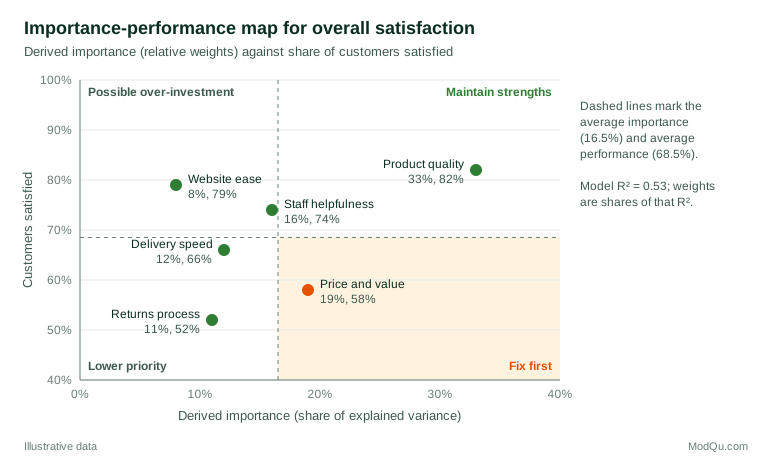
In Figure 1, product quality is both the most important attribute and a strength to protect. Price and value is the clear priority: it carries 19% of the explained variance but only 58% of customers are satisfied with it. The quadrant lines are conventions rather than thresholds, so attributes near them, such as staff helpfulness, deserve judgement rather than mechanical classification.
Practical guidance for survey and business data
- Design the questionnaire for the analysis. Cover the attributes that plausibly matter, word them distinctly, and avoid near-duplicates that will compete for the same variance.
- Watch for common method variance. When all ratings come from the same respondent on similar scales, part of their correlation reflects response style rather than substance (Podsakoff et al., 2003). Varying scale formats and including behavioural outcomes such as repeat purchase help.
- Allow for asymmetry. Poor performance on an attribute can hurt satisfaction more than good performance helps it. Mittal et al. (1998) found such asymmetric effects for attribute-level performance on overall satisfaction and repurchase intentions. Modelling negative and positive ratings separately can reveal "must-have" attributes that a linear model averages away.
- Report uncertainty and sample size. With small samples or many attributes, importance rankings can change between waves for purely statistical reasons. Show intervals and avoid reading small differences as real.
- Segment where it matters. Drivers often differ between customer groups, such as new and long-standing customers, and a pooled analysis can describe nobody well.
Common mistakes
- Reading coefficients as importance when attributes are correlated, as the returns example shows.
- Treating derived importance as causal. Driver analysis describes associations in cross-sectional survey data. It does not show that improving an attribute will raise satisfaction by the amount implied; causal claims need stronger designs (Holland, 1986). Overall satisfaction can also colour attribute ratings, reversing the assumed direction.
- Ignoring what is missing. Importance is shared only among the attributes in the model. An omitted driver, such as an unmeasured product feature, can make included attributes look more or less important than they are.
- Over-interpreting rankings. Two attributes with weights of 14% and 12% are usually not meaningfully different.
Key takeaways
Driver analysis helps decide where to act by estimating which attributes relate most strongly to overall satisfaction. Simple correlations overstate importance and regression coefficients distribute it erratically when attributes overlap. Relative importance methods, such as dominance analysis, Shapley value regression and relative weights, divide the explained variance more fairly and should be the default. Combine importance with performance to set priorities, report uncertainty, and remember that a driver is an association to be tested, not a proven cause.
References
Azen, R., & Budescu, D. V. (2003). The dominance analysis approach for comparing predictors in multiple regression. Psychological Methods, 8(2), 129–148. https://doi.org/10.1037/1082-989X.8.2.129
Budescu, D. V. (1993). Dominance analysis: A new approach to the problem of relative importance of predictors in multiple regression. Psychological Bulletin, 114(3), 542–551. https://doi.org/10.1037/0033-2909.114.3.542
Darlington, R. B. (1968). Multiple regression in psychological research and practice. Psychological Bulletin, 69(3), 161–182. https://doi.org/10.1037/h0025471
Grömping, U. (2007). Estimators of relative importance in linear regression based on variance decomposition. The American Statistician, 61(2), 139–147. https://doi.org/10.1198/000313007X188252
Holland, P. W. (1986). Statistics and causal inference. Journal of the American Statistical Association, 81(396), 945–960. https://doi.org/10.1080/01621459.1986.10478354
Johnson, J. W. (2000). A heuristic method for estimating the relative weight of predictor variables in multiple regression. Multivariate Behavioral Research, 35(1), 1–19. https://doi.org/10.1207/S15327906MBR3501_1
Johnson, J. W., & LeBreton, J. M. (2004). History and use of relative importance indices in organizational research. Organizational Research Methods, 7(3), 238–257. https://doi.org/10.1177/1094428104266510
Kruskal, W. (1987). Relative importance by averaging over orderings. The American Statistician, 41(1), 6–10. https://doi.org/10.1080/00031305.1987.10475432
Lipovetsky, S., & Conklin, M. (2001). Analysis of regression in game theory approach. Applied Stochastic Models in Business and Industry, 17(4), 319–330. https://doi.org/10.1002/asmb.446
Martilla, J. A., & James, J. C. (1977). Importance-performance analysis. Journal of Marketing, 41(1), 77–79. https://doi.org/10.1177/002224297704100112
Mittal, V., Ross, W. T., Jr., & Baldasare, P. M. (1998). The asymmetric impact of negative and positive attribute-level performance on overall satisfaction and repurchase intentions. Journal of Marketing, 62(1), 33–47. https://doi.org/10.1177/002224299806200104
Podsakoff, P. M., MacKenzie, S. B., Lee, J.-Y., & Podsakoff, N. P. (2003). Common method biases in behavioral research: A critical review of the literature and recommended remedies. Journal of Applied Psychology, 88(5), 879–903. https://doi.org/10.1037/0021-9010.88.5.879
Tonidandel, S., & LeBreton, J. M. (2011). Relative importance analysis: A useful supplement to regression analysis. Journal of Business and Psychology, 26(1), 1–9. https://doi.org/10.1007/s10869-010-9204-3