
Research · Market and business research
User Experience Research: Methods for Digital Products
The main methods of user experience research for websites, apps and software: how they differ, when to use each, how many participants they need, how to measure usability, and what the evidence says about their reliability.
User experience (UX) research studies how people use digital products such as websites, mobile apps and business software, and how they feel about using them. Its purpose is practical: to find out what people need, where a product gets in their way, and whether a change has made it better. UX research borrows from psychology, ethnography, market research and statistics, and has developed its own methods, such as usability testing and card sorting. This article describes the main methods, explains how to choose between them, and summarises what research says about their strengths and limits.
Usability and user experience
The two terms overlap but are not the same. The international standard ISO 9241-11 defines usability as the extent to which a product can be used by specified users to achieve specified goals with effectiveness, efficiency and satisfaction in a specified context of use (International Organization for Standardization, 2018). Effectiveness is whether people complete their tasks; efficiency is the effort or time it takes; satisfaction is how they feel about it.
User experience is broader. Hassenzahl and Tractinsky (2006) describe it as including the user's internal state (needs, expectations, mood), the characteristics of the product (including its look, purpose and functions), and the context in which the interaction takes place. A product can be usable but dull, or attractive but frustrating. UX research therefore studies needs and motivations as well as task performance.
The three components of usability do not always move together. Frøkjær et al. (2000) found weak correlations between effectiveness, efficiency and satisfaction in their data, and Hornbæk (2006), reviewing 180 studies, concluded that researchers should measure each aspect separately rather than assume that one stands in for the others.
Choosing a method
Rohrer (2022) organises UX methods along three dimensions:
- Attitudinal versus behavioural: whether the method records what people say (their beliefs, preferences and reported experiences) or what they do.
- Qualitative versus quantitative: whether data are gathered by observing and talking to people directly, which is suited to answering why and how to fix, or indirectly through measurement and instruments, which is suited to answering how many and how much.
- Context of use: whether participants use the product naturally, follow a script, use a limited version, or do not use it at all.
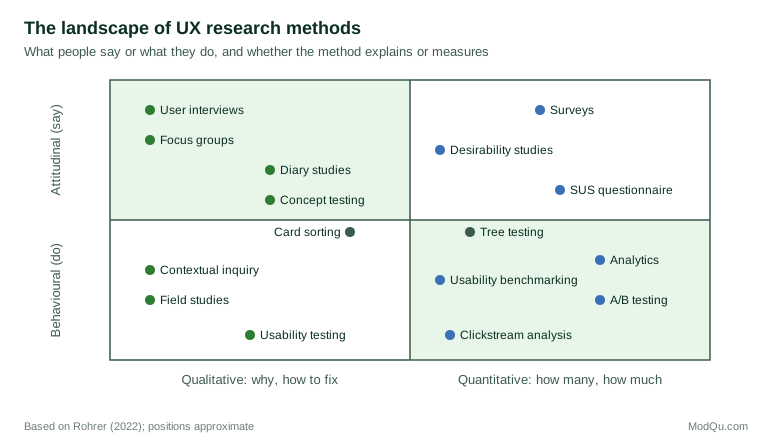
A second way to choose is by the stage of product development. Early on, the questions are about needs and opportunities, so methods that explore behaviour and context are most useful. During design, the questions are about whether a proposed design works, so usability testing and structure-testing methods dominate. After launch, the questions are about how well the product performs at scale, which calls for analytics, surveys and experiments. Lazar et al. (2017) provide a detailed treatment of these methods and their research design.
Methods for understanding needs
User interviews
One-to-one interviews explore how people currently approach a task, what tools they use, what frustrates them and what they are trying to achieve. Good interviews ask about specific recent events ("Tell me about the last time you paid an invoice") rather than general opinions or hypothetical futures, because people are poor at predicting their own behaviour. Portigal (2013) gives practical guidance on open questions, follow-up probes and avoiding leading the participant. Interviews are attitudinal: they report what people say, which may differ from what they do.
Contextual inquiry and field studies
Contextual inquiry combines observation and interview in the place where the work actually happens. Beyer and Holtzblatt (1998) describe the researcher adopting the role of an apprentice learning from a master: the participant carries out real tasks while the researcher watches and asks questions about what they see. The method reveals workarounds, interruptions, paper notes and other details that participants would not think to mention in an interview. It is especially valuable for business software, where the work context is complex.
Diary studies
In a diary study, participants record their experiences over days or weeks, usually each time a relevant event occurs. Diaries capture behaviour over time and in natural contexts, and reduce the memory errors of retrospective reports (Bolger et al., 2003). Carter and Mankoff (2005) compared diaries using different media, such as photographs, audio recordings and tangible objects, and found that the choice of medium affected what participants captured and how easily they could do so. Mobile phones have made diary studies much easier to run, since participants can send photographs, screenshots and short notes as events happen.
Surveys
Surveys measure attitudes, needs and reported behaviour across many people, and can size the problems found in qualitative work. They are useful for questions such as how many users rely on a given feature or how satisfaction differs between customer groups. Their limits are those of all self-report: people may not remember accurately, may not know why they behave as they do, and may answer to please the researcher.
Methods for evaluating designs
Usability testing
Usability testing is the core method of UX research. A participant from the target audience attempts realistic tasks with a product or prototype while a researcher observes. The researcher records whether tasks are completed, where the participant hesitates or makes errors, and what they say. Testing can be moderated, with a researcher present in person or by video, or unmoderated, with participants following on-screen instructions on their own while software records the session.
Most usability tests use the think-aloud technique, in which participants say what they are thinking as they work. The method rests on research by Ericsson and Simon (1980), who argued that verbal reports of thoughts currently in attention are valid data, provided participants are not asked to explain or interpret their thinking. In practice, usability moderators often prompt and probe more than this classic approach allows; Boren and Ramey (2000) found a gap between the theory and how practitioners actually conducted think-aloud sessions, and proposed guidelines for keeping interventions neutral.
Good tasks are realistic, specific and free of hints. "Find a pair of waterproof walking boots in your size for under $150" is better than "Use the filter menu", because it does not tell the participant how to proceed.
How many participants?
A frequently quoted rule is that five participants are enough for a usability test. It comes from work by Virzi (1992) and Nielsen and Landauer (1993), who modelled the proportion of usability problems found as a function of the number of participants. If each participant has a probability L of revealing a given problem, the share of problems found after n participants is 1 − (1 − L)n. Across the projects Nielsen and Landauer studied, L averaged about 0.31, which implies that five participants find about 84% of problems.
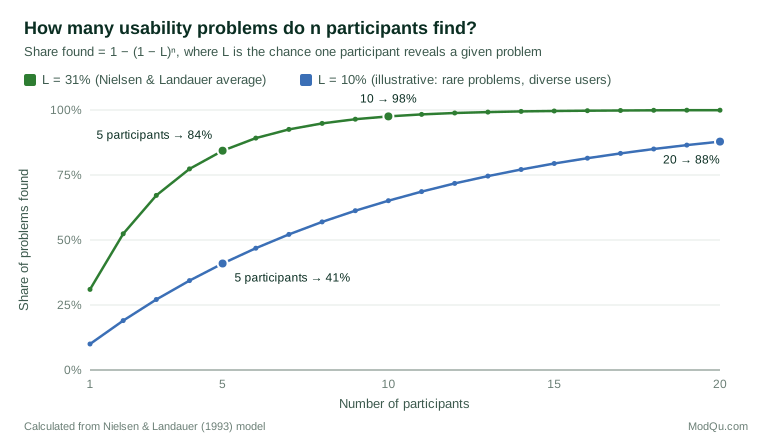
The rule has important conditions. It applies to finding problems in one design, with one type of user, carrying out a defined set of tasks. It assumes problems are reasonably common. Where the detection rate is lower, because problems are rare, users are diverse or the product is large, five participants find far fewer problems (Figure 2). Spool and Schroeder (2001), testing large websites, found that the first five users revealed only a small share of the problems eventually found. Faulkner (2003) ran repeated random samples from a pool of participants and showed that, although groups of five found 85% of problems on average, some groups of five found only 55%, while larger groups gave much more consistent results.
A sensible practice is to test with about five participants per distinct user group, fix what is found, and test again. Several small rounds across the design process usually find more problems than one large test. When the aim is to measure rather than to find problems, for example to compare task completion rates between two designs, much larger samples are needed and standard statistical methods apply (Sauro & Lewis, 2016).
Heuristic evaluation and expert review
In a heuristic evaluation, usability specialists inspect an interface against a set of recognised principles, such as visibility of system status, consistency and error prevention. Nielsen and Molich (1990) found that individual evaluators found only a minority of known problems, but that pooling the findings of several evaluators found many more. Expert review is fast and cheap but does not replace testing with real users, because experts may both miss problems and flag issues that do not trouble users.
Card sorting and tree testing
These methods test how information is organised. In card sorting, participants group content items, written on cards or shown on screen, into categories that make sense to them; in an open sort they also name the categories (Spencer, 2009). The results suggest navigation structures that match users' mental models. Tree testing works in the other direction: participants are shown a text-only version of a proposed menu structure and asked where they would look for specific items. The success rates show whether the structure works before any visual design is done.
Methods for measuring at scale
Usability metrics and questionnaires
Quantitative usability studies measure task success rates, time on task, error rates and post-task ratings (Tullis & Albert, 2013). Standardised questionnaires allow results to be compared over time and with other products. The most widely used is the System Usability Scale (SUS), a ten-item questionnaire that yields a score from 0 to 100 (Brooke, 1996). SUS scores are not percentages. Bangor et al. (2009) linked SUS scores to an adjective rating scale ranging from "worst imaginable" to "best imaginable" to help interpret them, and Sauro and Lewis (2016) report that the average SUS score across a large number of studies is about 68.
Analytics and product metrics
Analytics record what users actually do across the whole user base: pages visited, features used, steps abandoned and paths taken. They are strong on what and weak on why. Rodden et al. (2010), working at Google, proposed the HEART framework to choose user-centred metrics: Happiness (attitudes, often from surveys), Engagement (depth of use), Adoption (new users of a product or feature), Retention (users who return) and Task success (effectiveness and efficiency). They paired it with a Goals–Signals–Metrics process: state the goal for the product or feature, identify the user behaviour that would signal progress, and only then define the metric. This avoids tracking whatever is easiest to count.
A/B testing
An A/B test, or online controlled experiment, randomly assigns users to two or more versions of a page or feature and compares their behaviour. Because assignment is random, differences in outcomes can be attributed to the change itself. Kohavi, Longbotham, et al. (2009) describe the method's foundations and pitfalls, and Kohavi, Crook, et al. (2009) report that at Microsoft only about a third of ideas tested improved the metrics they were designed to improve, which shows how unreliable intuition about design changes can be. Kohavi et al. (2020) give detailed guidance on sample sizes, choice of metrics and threats to validity such as running many comparisons at once or stopping a test as soon as a result looks significant. A/B tests show which version performs better, but not why; qualitative research is needed to explain results and generate better ideas to test.
How reliable are UX research methods?
An uncomfortable finding is that different researchers studying the same product often find different problems. In a comparative study, Molich et al. (2004) asked nine professional teams to evaluate the same web-based email service. The teams reported a very large number of distinct problems between them, most problems were reported by only one team, and no problem was reported by every team. Hertzum and Jacobsen (2003) reviewed eleven studies of usability evaluation methods, including think-aloud testing and heuristic evaluation, and found that the average agreement between any two evaluators ranged from 5% to 65%. They called this the "evaluator effect".
These results do not mean the methods are useless, but they have practical implications:
- Use more than one evaluator where findings matter, and pool their observations.
- Define tasks and success criteria in advance, so that what counts as a problem is less dependent on individual judgement.
- Rate severity explicitly, using agreed criteria such as how many users are affected and whether they can recover.
- Combine methods, so that a problem seen in testing can be checked against analytics or survey data.
- Repeat tests after changes, rather than relying on a single round.
Planning a UX research programme
A research plan for a digital product should start from decisions, not methods. For each decision the team faces, the plan states the question that needs answering, the method best suited to it, the participants needed and the timing. A typical sequence for a new feature in an existing app might be:
- Review existing evidence: analytics, support tickets, app store reviews and earlier research.
- Explore needs with six to twelve interviews or a short diary study among the target users.
- Test concepts and structure with card sorting or tree testing if the feature changes navigation.
- Run iterative usability tests on prototypes, about five participants per round and per user group, fixing problems between rounds.
- Benchmark the near-final design with task success, time on task and SUS.
- Launch with an A/B test where traffic allows, tracking metrics chosen through Goals–Signals–Metrics.
- Monitor after launch with analytics and periodic surveys, feeding new problems back into research.
Recruiting participants
Results are only as relevant as the people who take part. Participants should match the product's actual or intended users on the characteristics that affect use, such as experience with the task, familiarity with similar products, the devices they use and any accessibility needs. Colleagues, friends and frequent paid testers are convenient but can give misleading results. Screening questionnaires should ask about behaviour ("How many times in the past month did you…") rather than self-description, and should not reveal what the study is about, so that applicants cannot guess the right answers.
Ethics and consent
UX research involves people, and the usual research ethics apply. Participants should know what the study involves, how recordings will be used and stored, and that they can stop at any time. Testing should make clear that the product, not the participant, is being evaluated. Particular care is needed with sensitive products, such as health or financial services, and with analytics and experiments, where users may not know they are part of a study. Data protection law in many jurisdictions also governs how recordings and behavioural data may be collected and kept.
Reporting findings
UX research has value only when it changes decisions. Effective reports lead with the findings that matter most, state how many participants encountered each problem, rate severity, and give specific recommendations. Short video clips of participants struggling are often more persuasive than written descriptions. Reports should be honest about limits: a qualitative test with five participants shows that a problem exists and suggests why, but does not estimate how many users it affects. Separating what was observed from what was inferred, and what was planned from what emerged unexpectedly, makes findings more credible to the teams who must act on them.
Summary
UX research for digital products uses a range of methods that differ in whether they capture what people say or what they do, whether they explain or measure, and how close they are to real use. Interviews, contextual inquiry and diary studies reveal needs; usability testing, expert review and card sorting evaluate designs; questionnaires, analytics and A/B tests measure performance at scale. Small qualitative tests are effective for finding problems when repeated through the design process, but they are not measurements, and different evaluators often see different problems. The most reliable programmes combine methods, define tasks and metrics in advance, and test again after every significant change.
References
Bangor, A., Kortum, P., & Miller, J. (2009). Determining what individual SUS scores mean: Adding an adjective rating scale. Journal of Usability Studies, 4(3), 114–123.
Beyer, H., & Holtzblatt, K. (1998). Contextual design: Defining customer-centered systems. Morgan Kaufmann.
Bolger, N., Davis, A., & Rafaeli, E. (2003). Diary methods: Capturing life as it is lived. Annual Review of Psychology, 54, 579–616.
Boren, T., & Ramey, J. (2000). Thinking aloud: Reconciling theory and practice. IEEE Transactions on Professional Communication, 43(3), 261–278.
Brooke, J. (1996). SUS: A "quick and dirty" usability scale. In P. W. Jordan, B. Thomas, B. A. Weerdmeester, & I. L. McClelland (Eds.), Usability evaluation in industry (pp. 189–194). Taylor & Francis.
Carter, S., & Mankoff, J. (2005). When participants do the capturing: The role of media in diary studies. In Proceedings of the SIGCHI Conference on Human Factors in Computing Systems (pp. 899–908). ACM.
Ericsson, K. A., & Simon, H. A. (1980). Verbal reports as data. Psychological Review, 87(3), 215–251.
Faulkner, L. (2003). Beyond the five-user assumption: Benefits of increased sample sizes in usability testing. Behavior Research Methods, Instruments, & Computers, 35(3), 379–383.
Frøkjær, E., Hertzum, M., & Hornbæk, K. (2000). Measuring usability: Are effectiveness, efficiency, and satisfaction really correlated? In Proceedings of the SIGCHI Conference on Human Factors in Computing Systems (pp. 345–352). ACM.
Hassenzahl, M., & Tractinsky, N. (2006). User experience: A research agenda. Behaviour & Information Technology, 25(2), 91–97.
Hertzum, M., & Jacobsen, N. E. (2003). The evaluator effect: A chilling fact about usability evaluation methods. International Journal of Human-Computer Interaction, 15(1), 183–204.
Hornbæk, K. (2006). Current practice in measuring usability: Challenges to usability studies and research. International Journal of Human-Computer Studies, 64(2), 79–102.
International Organization for Standardization. (2018). Ergonomics of human-system interaction: Part 11. Usability: Definitions and concepts (ISO Standard No. 9241-11:2018).
Kohavi, R., Crook, T., & Longbotham, R. (2009). Online experimentation at Microsoft [Paper presentation]. Third Workshop on Data Mining Case Studies and Practice Prize.
Kohavi, R., Longbotham, R., Sommerfield, D., & Henne, R. M. (2009). Controlled experiments on the web: Survey and practical guide. Data Mining and Knowledge Discovery, 18(1), 140–181.
Kohavi, R., Tang, D., & Xu, Y. (2020). Trustworthy online controlled experiments: A practical guide to A/B testing. Cambridge University Press. https://doi.org/10.1017/9781108653985
Lazar, J., Feng, J. H., & Hochheiser, H. (2017). Research methods in human-computer interaction (2nd ed.). Morgan Kaufmann.
Molich, R., Ede, M. R., Kaasgaard, K., & Karyukin, B. (2004). Comparative usability evaluation. Behaviour & Information Technology, 23(1), 65–74.
Nielsen, J., & Landauer, T. K. (1993). A mathematical model of the finding of usability problems. In Proceedings of the INTERACT '93 and CHI '93 Conference on Human Factors in Computing Systems (pp. 206–213). ACM.
Nielsen, J., & Molich, R. (1990). Heuristic evaluation of user interfaces. In Proceedings of the SIGCHI Conference on Human Factors in Computing Systems (pp. 249–256). ACM.
Portigal, S. (2013). Interviewing users: How to uncover compelling insights. Rosenfeld Media.
Rodden, K., Hutchinson, H., & Fu, X. (2010). Measuring the user experience on a large scale: User-centered metrics for web applications. In Proceedings of the SIGCHI Conference on Human Factors in Computing Systems (pp. 2395–2398). ACM.
Rohrer, C. (2022, July 17). When to use which user-experience research methods. Nielsen Norman Group. https://www.nngroup.com/articles/which-ux-research-methods/
Sauro, J., & Lewis, J. R. (2016). Quantifying the user experience: Practical statistics for user research (2nd ed.). Morgan Kaufmann.
Spencer, D. (2009). Card sorting: Designing usable categories. Rosenfeld Media.
Spool, J., & Schroeder, W. (2001). Testing web sites: Five users is nowhere near enough. In CHI '01 Extended Abstracts on Human Factors in Computing Systems (pp. 285–286). ACM.
Tullis, T., & Albert, B. (2013). Measuring the user experience: Collecting, analyzing, and presenting usability metrics (2nd ed.). Morgan Kaufmann.
Virzi, R. A. (1992). Refining the test phase of usability evaluation: How many subjects is enough? Human Factors, 34(4), 457–468.