
Research · Market and business research
Research for Small Businesses on a Limited Budget
How small businesses can answer practical questions about customers, demand and pricing with low-cost research: using existing data, customer interviews, short surveys and small experiments, and avoiding the errors that make cheap research misleading.
Small businesses make the same kinds of decisions as large firms: which customers to serve, what to charge, which product to build next, and whether a marketing message works. They usually make them with far less information. Gilmore et al. (2001) describe marketing in small and medium-sized enterprises as constrained by limited money, limited specialist expertise and limited reach, and as shaped heavily by the owner-manager's own judgement and personal contacts. A full commissioned study from a research agency is often out of reach. This does not mean that research is out of reach. Many of the most useful methods cost little more than time, and the evidence on sample sizes, survey design and experiments shows that small, well-designed studies can answer many practical questions reliably. This article sets out how a small business can plan research on a limited budget, which low-cost methods suit which questions, and how to avoid the errors that make cheap research misleading.
Start with the decision, not the method
The most common way to waste a research budget is to collect data without a clear question. A survey that asks customers about everything usually answers nothing in particular. A better starting point is the decision the business faces. Examples include: should we open on Sundays; is there demand for a delivery service; which of two price points loses fewer customers; why are first-time buyers not returning?
For each decision, it helps to write down three things before choosing a method:
- The question. What exactly do we need to know? "Do customers like us?" is too broad. "What share of last year's customers would use a delivery service at a $5 fee?" is specific enough to answer.
- The action. What will we do differently depending on the answer? If no answer would change the decision, the research is not worth doing.
- The threshold. What result would be enough to act? For example, "If at least 20% of surveyed customers say they would use delivery, we will run a three-month trial."
Writing the threshold down in advance protects against a common trap: looking at the results first and then deciding what they mean. The same discipline is used in formal research, where analysis plans are registered before data are collected. It costs nothing and makes small studies far more credible.
Use what already exists
Secondary research, the use of information that someone else has already collected, is usually the cheapest place to begin.
Internal records. Sales records, invoices, booking systems, website analytics, customer emails and complaint logs are research data. A simple analysis of which products sell together, which customers buy again, or which web pages people leave from can answer questions that would otherwise need a survey. The main cost is the time to export and organise the data.
Public statistics. National statistical agencies publish population, income, household and business data by area, usually free of charge. In Canada, Statistics Canada's census tables describe the population of each community, and business counts show how many competitors of a given type operate in an area. Industry associations and government small business offices often publish sector summaries.
Search and online data. Search interest data can show whether interest in a product or service is rising, falling or seasonal. Choi and Varian (2012) showed that Google Trends data improved short-term forecasts of economic indicators such as motor vehicle sales, unemployment claims and travel. For a small business, the same tool gives a quick view of seasonal patterns and relative interest in different terms, though it shows relative interest rather than numbers of customers.
Competitor information. Competitors' websites, price lists, menus, job postings and public reviews show what they offer, what they charge and what their customers praise or complain about. Reviews are not a representative sample of customers, but they are a free source of the language customers use and of recurring problems.
Secondary data rarely answers the whole question, but it narrows it, so that any primary research that follows can be shorter and more focused.
Talk to customers properly
Interviews are one of the most efficient research methods available to a small business. They need no special software, and a small number can reveal most of what matters. Griffin and Hauser (1993), in a study of how to identify customer needs for product development, estimated that one-to-one interviews with 20 to 30 customers would identify roughly 90% or more of the needs in a product category. Research on qualitative sample sizes points the same way. Guest et al. (2006) analysed 60 interviews and found that almost all the themes had been identified within the first 12. A systematic review of empirical tests by Hennink and Kaiser (2022) found that saturation, the point at which new interviews add little new information, was typically reached within 9 to 17 interviews, or 4 to 8 focus groups, when the study population was fairly homogeneous and the objectives were narrow.
These numbers apply to discovering what issues exist. They do not tell you how common each issue is; that needs counting, usually through a survey or records. But for understanding why customers buy, what frustrates them and what they would value, a dozen well-run conversations is a sensible starting point.
The quality of the conversation matters more than the number of interviews. People are generally polite and will often say they like an idea to avoid disappointing the person asking. Fitzpatrick (2013), writing for founders, recommends asking about specific past behaviour rather than opinions or hypothetical future choices. "Would you buy this?" invites a kind answer. "When did you last have this problem, and what did you do about it?" invites a factual one. Christensen et al. (2016) make a related point: customers "hire" a product to make progress in a particular situation, so understanding the circumstances in which they buy is more useful than collecting their demographic profile.
Practical guidance for low-cost interviews:
- Recruit from existing customers, lapsed customers and people who considered you but bought elsewhere. Each group tells you something different.
- Prepare five to eight open questions, but follow the conversation where it is useful.
- Do not pitch. The aim is to learn, not to sell.
- Take notes or, with permission, record. Write a short summary immediately afterwards while the conversation is fresh.
- Look for patterns across interviews rather than acting on a single vivid comment.
Analysis can be simple. Braun and Clarke (2006) describe thematic analysis as a process of becoming familiar with the data, coding it, and grouping codes into themes that are then reviewed and defined. For a small business, a spreadsheet with one row per interview and one column per question or theme is often enough. Taylor et al. (2018) compared a rapid, summary-based analysis with a full thematic analysis of the same evaluation data and found substantial overlap in the findings, which suggests that a structured shortcut can be adequate when decisions are practical rather than academic.
Focus groups are another option, but they are harder to run well. Morgan (1997) notes that their value lies in the interaction between participants; that same interaction allows a confident speaker to steer the group. For most small business questions, individual interviews are simpler and give each person a full say.
Run short surveys that people will finish
Surveys are the usual way to measure how common something is. Free and low-cost online survey tools have removed most of the direct cost, but they have not removed the main sources of error. Couper (2000) set out the errors that affect web surveys: coverage (who could be reached at all), sampling (who was invited), nonresponse (who chose to answer) and measurement (whether the questions captured what was intended).
Keep it short. Galesic and Bosnjak (2009) found that when a web survey was announced as longer, fewer people started it, and that answers to questions placed later in the questionnaire were faster, shorter and less varied. A small business survey should usually take no more than five minutes. Every question should connect to the decision the research supports.
Write clear questions. Tourangeau et al. (2000) describe answering a survey question as four tasks: understanding it, recalling relevant information, forming a judgement and reporting an answer. Each stage can go wrong. Avoid questions that ask two things at once ("How satisfied are you with our price and quality?"), vague time frames ("recently") and terms customers might not know. Krosnick (1991) showed that when questions demand too much effort, respondents tend to "satisfice": they pick the first reasonable answer, agree with statements, or choose the same scale point repeatedly. Short, concrete questions reduce this.
Encourage response. A Cochrane systematic review by Edwards et al. (2009) found that response rates to postal and electronic questionnaires could be increased by measures such as incentives, shorter questionnaires and personalised contact. Dillman et al. (2014) recommend multiple, well-timed contacts, a clear explanation of why the survey matters, and making it easy to respond. A small prize draw or a discount on the next purchase is often affordable.
Do not over-interpret the response rate. A low response rate does not automatically mean the results are biased. In a meta-analysis of 59 studies, Groves and Peytcheva (2008) found that the nonresponse rate was a poor predictor of nonresponse bias. Bias arises when the people who answer differ from those who do not on the questions being asked. A survey of loyal customers about loyalty will be biased whatever the response rate; a survey with a modest response from a broad customer list may be fine.
How many responses are enough?
For a survey that estimates a percentage, the precision depends mainly on the number of responses, not on the size of the customer base. The margin of error for a percentage at the 95% confidence level is about 1.96 multiplied by the square root of p(1 − p)/n, where p is the proportion and n is the number of responses. It is largest when p is 50%.
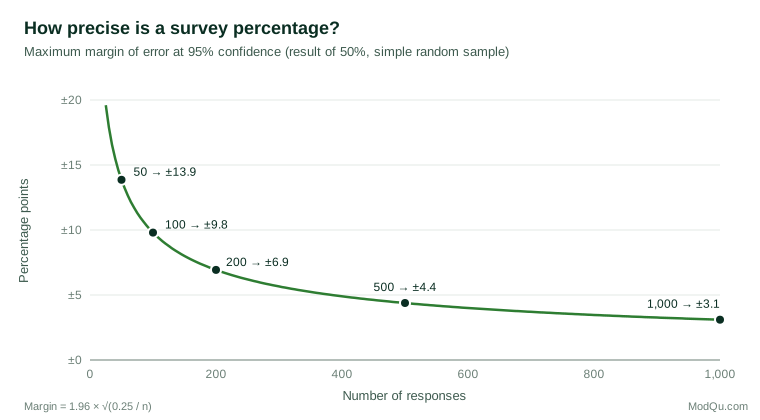
Figure 1 shows the practical consequence. With 100 responses, a result of 50% could plausibly lie anywhere between about 40% and 60%. With 400 responses, the range narrows to about 45% to 55%. Beyond a few hundred responses, each additional response adds little precision. For many small business decisions, such as whether interest in a new service is closer to 10% or closer to 40%, 100 to 200 responses is enough. For a close decision, such as distinguishing 48% from 52%, no affordable survey will settle the matter, and an experiment is usually a better tool.
These calculations assume that respondents are a random sample of the population of interest. A convenience sample, such as people who follow the business on social media, can still be useful, but the margin of error then understates the real uncertainty because the sample may differ systematically from the wider market.
Test instead of asking
What people say they will do and what they actually do often differ. Where possible, the most reliable low-cost research is a small test of real behaviour.
Online experiments. An A/B test shows two versions of a web page, email or advertisement to randomly assigned groups and compares what they do. Kohavi and Thomke (2017) argue that disciplined online experiments give organisations evidence that intuition cannot, and report that at Microsoft only about a third of the ideas tested improved the metrics they were designed to improve. Most email and website platforms used by small businesses include basic A/B testing. Kohavi et al. (2020) stress the conditions for trustworthy results: decide the metric and the sample size in advance, run the test for full weeks to cover weekly cycles, and do not stop early because a result looks good.
Offline trials. The same logic applies outside the web. A café can offer a new item on alternate days, a retailer can vary a display between two similar stores, and a service business can offer a new package to half of its enquiries. Random or alternating assignment is what makes the comparison fair.
Minimum viable tests of demand. Ries (2011) popularised the idea of a minimum viable product: the simplest version of an offer that allows a business to learn from real customer behaviour. A landing page that takes pre-orders, a small paid advertisement that measures click-through, or a limited trial run can reveal demand before a large investment is made. Blank (2013) describes this approach as getting out of the building to test assumptions with customers rather than writing plans in isolation.
There is evidence that this way of working improves decisions. In a randomised trial with 116 Italian start-ups, Camuffo et al. (2020) trained one group of founders to frame their business ideas as hypotheses and test them systematically. Compared with the control group, trained founders were more likely to pivot to a different idea, were no less likely to abandon their venture, and earned higher revenue.
Matching methods to questions
Different questions need different methods. Figure 2 sets out a simple guide.
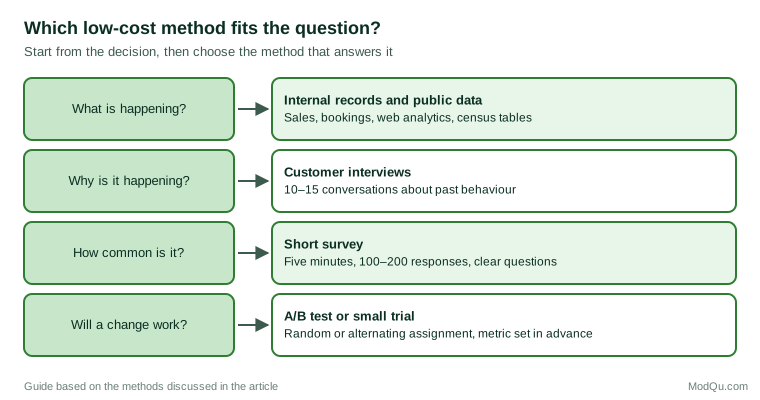
In practice, methods are often combined in sequence. Records show that repeat purchases have fallen; interviews with lapsed customers suggest that delivery times are the main cause; a short survey estimates how many customers are affected; and a trial of faster delivery in one area tests whether the problem can be fixed. Each step is small and cheap, and each one makes the next more focused.
Be careful with single-number metrics
Small businesses are often advised to track one headline customer measure. The best known is the Net Promoter Score, based on the question "How likely is it that you would recommend us to a friend or colleague?" Reichheld (2003) proposed it as the one number a company needs to grow. Later research was more cautious. Keiningham et al. (2007) tested the claim using longitudinal data and found no evidence that the Net Promoter Score predicted company growth better than other customer satisfaction measures. A single score can be a useful way to track change over time, but it does not explain why customers feel as they do. It works best alongside an open question asking for the reason behind the rating.
Common errors in low-cost research
- Asking only friends, family or loyal customers. They are the easiest to reach and the least likely to criticise.
- Leading questions. "How much do you like our new menu?" assumes the answer. "What do you think of the new menu?" does not.
- Treating stated intentions as sales. Interest in a survey usually overstates real purchases. Test with behaviour wherever possible.
- Acting on one comment. A single strong complaint may be important, but it should prompt a check, not an immediate change.
- Looking for patterns after the fact. Splitting survey results into many subgroups will always turn up some apparent differences by chance. Decide the comparisons that matter before seeing the data.
- Stopping tests early. Ending an A/B test as soon as one version looks better greatly increases the chance of a false result (Kohavi et al., 2020).
A practical low-budget research plan
A small business can run a useful research cycle in a few weeks with very little cash outlay:
- Week 1: define and review. Write down the decision, the question, the possible actions and the threshold for acting. Review internal records and free public data.
- Weeks 2–3: interview. Hold 10 to 15 short interviews with a mix of current, lapsed and potential customers. Summarise each and group the findings into themes.
- Week 4: measure. If the decision depends on how common something is, run a five-minute survey to the customer list, using themes from the interviews to write the questions.
- Weeks 5–8: test. Where possible, test the proposed change with a small experiment or trial, with the success measure fixed in advance.
- Afterwards: record. Write a one-page summary of what was asked, what was found and what was decided, so that the next round of research builds on it.
The direct costs of such a plan are small: survey incentives, perhaps a modest advertising budget for a demand test, and the owner's or staff time. The main investment is in thinking clearly about the question before collecting any data.
When to pay for help
Low-cost research has limits. Some questions need a representative sample of a population the business cannot reach on its own, such as residents of a new market area or buyers in another sector. Some need specialist techniques, such as conjoint analysis for complex pricing decisions or carefully designed tracking studies. In these cases, a small commissioned piece of work, or buying a few questions on a shared survey run by a research supplier, can be good value. Even then, doing the groundwork described above makes outside research cheaper and more useful, because the business arrives with a clear question, evidence from its own records and a sense of what customers say.
For most day-to-day decisions, however, a small business does not need a large budget. It needs a clear question, a method suited to it, honest questions put to the right people, and a willingness to let the evidence change the plan.
References
Blank, S. (2013). Why the lean start-up changes everything. Harvard Business Review, 91(5), 63–72.
Braun, V., & Clarke, V. (2006). Using thematic analysis in psychology. Qualitative Research in Psychology, 3(2), 77–101. https://doi.org/10.1191/1478088706qp063oa
Camuffo, A., Cordova, A., Gambardella, A., & Spina, C. (2020). A scientific approach to entrepreneurial decision making: Evidence from a randomized control trial. Management Science, 66(2), 564–586. https://doi.org/10.1287/mnsc.2018.3249
Choi, H., & Varian, H. (2012). Predicting the present with Google Trends. Economic Record, 88(s1), 2–9. https://doi.org/10.1111/j.1475-4932.2012.00809.x
Christensen, C. M., Hall, T., Dillon, K., & Duncan, D. S. (2016). Know your customers' "jobs to be done." Harvard Business Review, 94(9), 54–62.
Couper, M. P. (2000). Web surveys: A review of issues and approaches. Public Opinion Quarterly, 64(4), 464–494. https://doi.org/10.1086/318641
Dillman, D. A., Smyth, J. D., & Christian, L. M. (2014). Internet, phone, mail, and mixed-mode surveys: The tailored design method (4th ed.). Wiley.
Edwards, P. J., Roberts, I., Clarke, M. J., DiGuiseppi, C., Wentz, R., Kwan, I., Cooper, R., Felix, L. M., & Pratap, S. (2009). Methods to increase response to postal and electronic questionnaires. Cochrane Database of Systematic Reviews, (3), Article MR000008. https://doi.org/10.1002/14651858.MR000008.pub4
Fitzpatrick, R. (2013). The mom test: How to talk to customers and learn if your business is a good idea when everyone is lying to you. CreateSpace Independent Publishing Platform.
Galesic, M., & Bosnjak, M. (2009). Effects of questionnaire length on participation and indicators of response quality in a web survey. Public Opinion Quarterly, 73(2), 349–360. https://doi.org/10.1093/poq/nfp031
Gilmore, A., Carson, D., & Grant, K. (2001). SME marketing in practice. Marketing Intelligence & Planning, 19(1), 6–11.
Griffin, A., & Hauser, J. R. (1993). The voice of the customer. Marketing Science, 12(1), 1–27. https://doi.org/10.1287/mksc.12.1.1
Groves, R. M., & Peytcheva, E. (2008). The impact of nonresponse rates on nonresponse bias: A meta-analysis. Public Opinion Quarterly, 72(2), 167–189. https://doi.org/10.1093/poq/nfn011
Guest, G., Bunce, A., & Johnson, L. (2006). How many interviews are enough? An experiment with data saturation and variability. Field Methods, 18(1), 59–82. https://doi.org/10.1177/1525822X05279903
Hennink, M., & Kaiser, B. N. (2022). Sample sizes for saturation in qualitative research: A systematic review of empirical tests. Social Science & Medicine, 292, Article 114523. https://doi.org/10.1016/j.socscimed.2021.114523
Keiningham, T. L., Cooil, B., Andreassen, T. W., & Aksoy, L. (2007). A longitudinal examination of net promoter and firm revenue growth. Journal of Marketing, 71(3), 39–51. https://doi.org/10.1509/jmkg.71.3.039
Kohavi, R., Tang, D., & Xu, Y. (2020). Trustworthy online controlled experiments: A practical guide to A/B testing. Cambridge University Press. https://doi.org/10.1017/9781108653985
Kohavi, R., & Thomke, S. (2017). The surprising power of online experiments: Getting the most out of A/B and other controlled tests. Harvard Business Review, 95(5), 74–82.
Krosnick, J. A. (1991). Response strategies for coping with the cognitive demands of attitude measures in surveys. Applied Cognitive Psychology, 5(3), 213–236. https://doi.org/10.1002/acp.2350050305
Morgan, D. L. (1997). Focus groups as qualitative research (2nd ed.). Sage.
Reichheld, F. F. (2003). The one number you need to grow. Harvard Business Review, 81(12), 46–54.
Ries, E. (2011). The lean startup: How today's entrepreneurs use continuous innovation to create radically successful businesses. Crown Business.
Taylor, B., Henshall, C., Kenyon, S., Litchfield, I., & Greenfield, S. (2018). Can rapid approaches to qualitative analysis deliver timely, valid findings to clinical leaders? A mixed methods study comparing rapid and thematic analysis. BMJ Open, 8(10), Article e019993. https://doi.org/10.1136/bmjopen-2017-019993
Tourangeau, R., Rips, L. J., & Rasinski, K. (2000). The psychology of survey response. Cambridge University Press.