
Research · Quantitative and mixed methods
Quantitative Research: Measurement, Variables and Analysis
An introduction to quantitative research covering how concepts are turned into measurable variables, levels of measurement, types of variables, the main kinds of analysis, and common pitfalls in interpreting numbers.
Quantitative research answers questions with numbers. It measures characteristics of people, organisations or events, and uses statistical analysis to describe patterns, compare groups and test relationships. Creswell and Creswell (2018) described it as an approach for testing objective theories by examining the relationships among variables, which can be measured so that numbered data can be analysed using statistical procedures. This article explains the three building blocks of quantitative research: measurement, variables and analysis.
From concepts to measures
Research questions are usually framed in terms of concepts, such as customer satisfaction, job stress or brand awareness. Concepts cannot be counted directly. They must first be defined and then operationalised: turned into specific procedures that produce numbers. Bryman (2016) described this as moving from a concept to an indicator, the observable thing that stands for it.
For example, "customer satisfaction" might be operationalised as the answer to a survey question rated from 1 to 10, as the average of several related questions, or as the rate of repeat purchases. Each choice measures something slightly different. Hand (2004) emphasised that measurement is never simply reading off a value that already exists; it involves choices about what to count and how, and those choices shape what the numbers mean.
Good measures are reliable, giving consistent results when repeated, and valid, measuring what they are meant to measure. A survey question that different people interpret in different ways may be reliable for each person but valid for none. Groves et al. (2009) described the gap between a concept and the answers obtained as measurement error, one of several sources of error that quantitative researchers must manage.
Levels of measurement
Stevens (1946) proposed four levels of measurement, which remain the standard starting point. The table below summarises them.
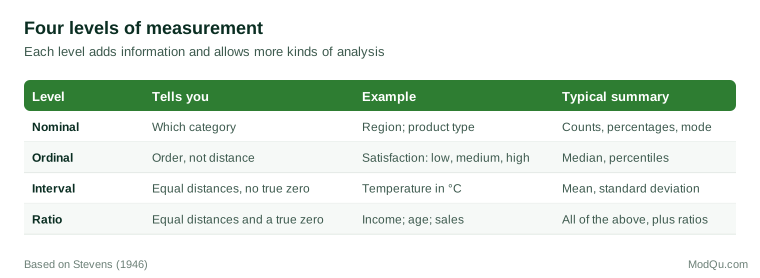
Nominal measures place cases in categories with no order, such as region or product type. Ordinal measures place cases in order but do not say how far apart they are, such as satisfaction rated as low, medium or high. Interval measures have equal distances between values but no true zero, such as temperature in degrees Celsius. Ratio measures have equal intervals and a true zero, so that one value can be said to be twice another, such as income or age.
The level of measurement determines which summaries and tests make sense. An average of region codes is meaningless; an average of incomes is not. Velleman and Wilkinson (1993) cautioned that the typology should not be applied mechanically, because the appropriate analysis depends on the question as well as on the scale. Rating scales, for example, are strictly ordinal but are often analysed as if they were interval, which is usually reasonable when there are several points and the analysis is robust.
Types of variables
A variable is any characteristic that varies across cases. Variables are classified by their role in the research.
- Independent variables are those the researcher believes influence an outcome. In an experiment, they are manipulated; in other designs, they are measured.
- Dependent variables are the outcomes the researcher wants to explain.
- Control variables are other factors measured so that their influence can be separated from that of the independent variable.
- Mediating variables lie on the path between cause and effect, explaining how the effect happens.
- Moderating variables change the strength or direction of a relationship.
Baron and Kenny (1986) set out the distinction between mediators and moderators, which is easily confused. If training improves sales because it increases product knowledge, product knowledge is a mediator. If training improves sales more for new staff than for experienced staff, experience is a moderator.
Analysis
Quantitative analysis usually moves through three stages.
Exploring and describing. Tukey (1977) urged researchers to look at their data before testing anything, using plots and simple summaries to see distributions, outliers and patterns. Descriptive statistics, such as means, medians, percentages and standard deviations, summarise what the data show.
Estimating relationships. Correlation and regression measure how variables move together. Comparisons between groups show whether outcomes differ, for example between customers who did and did not receive an offer. Effect sizes express how large a difference or relationship is. Cohen (1988) proposed conventions for small, medium and large effects, though he stressed that what counts as important depends on the field.
Making inferences. When data come from a sample, inferential statistics estimate what is likely to be true in the wider population. Confidence intervals give a range of plausible values. Significance tests ask whether a result could easily have arisen by chance. Cumming (2014) argued that researchers should focus on estimates and confidence intervals rather than on whether a result is "significant", because intervals show both the size of an effect and the uncertainty around it.
Choosing an analysis
The choice of statistical technique follows from three questions: what is the research question, how many variables are involved, and at what level is each measured? Field (2018) organised common techniques by these features. Comparing the average of a ratio outcome between two groups calls for a t-test or its equivalent; comparing three or more groups calls for analysis of variance. Relating two continuous measures calls for correlation, and predicting an outcome from several variables at once calls for regression. When the outcome is a category, such as whether a customer renewed or not, logistic regression or tests for counts are used instead. Each technique also rests on assumptions, such as roughly normal distributions or independent observations, and these should be checked before results are trusted. When assumptions fail, alternatives exist, such as tests based on ranks or methods that resample the data. The aim is to fit the analysis to the question and the data, not to use the most complex method available.
Common pitfalls
Several mistakes recur in quantitative research:
- Confusing significance with importance. Wasserstein and Lazar (2016), writing for the American Statistical Association, stated that a p-value does not measure the size of an effect or the importance of a result, and that scientific conclusions should not be based only on whether a p-value passes a threshold.
- Confusing correlation with causation. Shadish et al. (2002) noted that a causal claim requires the cause to come first, the two to be related, and alternative explanations to be ruled out. Correlation meets only the second condition.
- Ignoring measurement quality. Sophisticated analysis cannot rescue poor measures.
- Analysing many variables until something is significant. With enough tests, some will reach significance by chance.
Quantitative research in practice
A hypothetical example illustrates the stages. A retailer wants to know whether a loyalty programme increases spending. The concept "spending" is operationalised as monthly purchases in dollars, a ratio measure. Membership is a nominal independent variable. Customer age and region are control variables. Exploration shows that spending is skewed, with a few very large buyers, so medians are reported alongside means. A regression estimates that members spend more than non-members of similar age and region, with a confidence interval around the estimate. Because customers chose whether to join, the retailer cannot conclude that the programme caused the difference: members may have been bigger spenders already. The numbers are illustrative, but the reasoning shows how measurement, variables and analysis fit together, and where their limits lie.
Conclusion
Quantitative research depends on careful measurement, a clear view of the role each variable plays, and analysis that matches both the data and the question. Its strength is precision: it can say how much, how often and how strongly. That precision is only as good as the measures behind it and the care taken in interpreting results, which is why the building blocks deserve as much attention as the statistics.
References
Baron, R. M., & Kenny, D. A. (1986). The moderator–mediator variable distinction in social psychological research: Conceptual, strategic, and statistical considerations. Journal of Personality and Social Psychology, 51(6), 1173–1182. https://doi.org/10.1037/0022-3514.51.6.1173
Bryman, A. (2016). Social research methods (5th ed.). Oxford University Press.
Cohen, J. (1988). Statistical power analysis for the behavioral sciences (2nd ed.). Lawrence Erlbaum Associates.
Creswell, J. W., & Creswell, J. D. (2018). Research design: Qualitative, quantitative, and mixed methods approaches (5th ed.). SAGE.
Cumming, G. (2014). The new statistics: Why and how. Psychological Science, 25(1), 7–29. https://doi.org/10.1177/0956797613504966
Field, A. (2018). Discovering statistics using IBM SPSS Statistics (5th ed.). SAGE.
Groves, R. M., Fowler, F. J., Jr., Couper, M. P., Lepkowski, J. M., Singer, E., & Tourangeau, R. (2009). Survey methodology (2nd ed.). Wiley.
Hand, D. J. (2004). Measurement theory and practice: The world through quantification. Arnold.
Shadish, W. R., Cook, T. D., & Campbell, D. T. (2002). Experimental and quasi-experimental designs for generalized causal inference. Houghton Mifflin.
Stevens, S. S. (1946). On the theory of scales of measurement. Science, 103(2684), 677–680. https://doi.org/10.1126/science.103.2684.677
Tukey, J. W. (1977). Exploratory data analysis. Addison-Wesley.
Velleman, P. F., & Wilkinson, L. (1993). Nominal, ordinal, interval, and ratio typologies are misleading. The American Statistician, 47(1), 65–72. https://doi.org/10.1080/00031305.1993.10475938
Wasserstein, R. L., & Lazar, N. A. (2016). The ASA statement on p-values: Context, process, and purpose. The American Statistician, 70(2), 129–133. https://doi.org/10.1080/00031305.2016.1154108