
Research · Market and business research
Product Research and New Product Development
How research supports each stage of new product development, from finding customer needs to testing concepts and forecasting sales, and what the evidence shows about why new products succeed or fail.
New products carry a large share of a company's future revenue and a large share of its risk. Research reduces that risk by replacing assumptions about customers, markets and demand with evidence gathered before the major costs are committed. This article describes the research methods used at each stage of new product development (NPD), what each can and cannot tell a development team, and what decades of studies show about the factors that separate successful products from failures.
How often new products fail
Figures such as "80% of new products fail" are often repeated in business writing. Castellion and Markham (2013) traced these claims and found that they were rarely supported by data. Empirical studies of new product outcomes point to failure rates of about 40%, which is high but well below the popular figure. The exact rate depends on how failure is defined and on the industry.
A large study of consumer packaged goods gives a more precise picture. Victory et al. (2021) followed 83,719 new stock-keeping units (SKUs) launched in the United States between 2002 and 2009. One in four was no longer being bought a year after launch, and about 40% two years after launch. Failure was more likely for launches by brands with smaller market shares and for launches into higher-revenue categories. Whatever the exact rate, the cost of a failed launch, in development spending, production tooling, listing fees and marketing, gives research a clear economic case.
What separates winners from losers
Research on new product performance is one of the largest bodies of evidence in marketing. Cooper and Kleinschmidt (1987) compared about 200 successful and unsuccessful products in industrial firms. The strongest predictor of success was product advantage: a product that was superior to competing products and offered unique benefits that customers valued. Products whose development included sound early work, such as market assessment and a clear product definition before design began, were also much more likely to succeed.
Meta-analyses, which combine the results of many studies, have repeated this pattern. Montoya-Weiss and Calantone (1994) reviewed 47 studies and found that product advantage and the proficiency of early market and technical activities were among the most consistent determinants of performance. Henard and Szymanski (2001) examined 24 predictors and found that product advantage, market potential, meeting customer needs, proficiency in predevelopment tasks and dedicated resources had, on average, the most significant effect on performance. Evanschitzky et al. (2012) updated this work with a larger set of studies and confirmed that product characteristics such as advantage and meeting customer needs remain among the most important factors.
Product advantage and fit with customer needs are things that research can measure before launch. A company cannot know whether its product is superior in the eyes of customers without asking them, observing them or testing the product with them.
The development process and where research fits
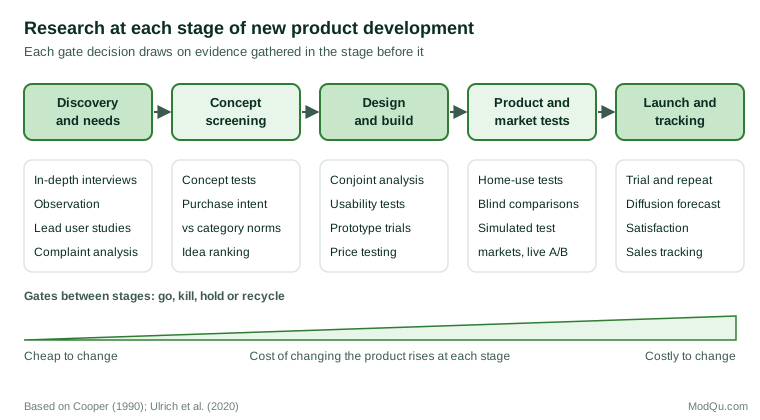
Most organisations manage new products through a staged process. The best-known version is Cooper's (1990) Stage-Gate system, in which a project moves through a series of stages, such as scoping, building the business case, development, testing and launch. Between stages are "gates," decision points at which management decides whether to continue, stop, put the project on hold or send it back for more work. Ulrich et al. (2020) describe a similar sequence in engineering design: identifying customer needs, setting target specifications, generating and selecting concepts, testing, and refining.
The purpose of the gates is to stop weak projects early, when stopping is cheap. Research supplies much of the evidence on which gate decisions are made. Figure 1 shows the main research activities at each stage.
Stage 1: Understanding customer needs
The earliest research aims to understand what customers are trying to achieve and where existing products fall short. This is mainly qualitative: in-depth interviews, observation of customers using products in their own settings, and analysis of complaints and support requests.
Griffin and Hauser (1993) studied how many interviews are needed to identify customer needs. In their work, interviews with 20 to 30 customers identified roughly 90% or more of the needs in a product category. They also found that a two-hour focus group identified about as many needs as two one-hour individual interviews, so group discussion did not add much, and that using several analysts to read interview transcripts uncovered needs that a single analyst missed.
Christensen et al. (2016) argue that development teams should study the "job" a customer is trying to get done in a particular situation, rather than customer demographics or product attributes alone. The question changes from "who buys our product?" to "what progress is the customer trying to make when they buy it?" This framing often reveals competitors and substitutes that a product-category view misses.
Needs research has a known limit. Customers can describe their current problems well, but they find it hard to imagine solutions that are far from what they already know. Von Hippel (1986) proposed studying lead users: customers who face needs months or years before most of the market and who often build their own solutions. Because lead users experience future conditions early, their needs and improvised solutions can point to products that ordinary customers would not request.
Lilien et al. (2002) assessed the lead user method at 3M by comparing lead user projects with projects generated by the company's usual methods over the same period. The lead user projects had projected annual sales after five years averaging about $146 million, more than eight times the forecast sales of the conventional projects. These were forecasts rather than realised sales, but they show the potential of looking beyond the average customer when the aim is a substantially new product.
Stage 2: Concept testing
Once a team has a product idea, it can test the concept before building the product. A concept test presents a description of the product, often with a picture, a price and the main benefits, to a sample of target customers. Respondents rate how appealing they find it, how likely they would be to buy it, how it compares with what they use now, and what they like and dislike about it.
Concept tests are cheap compared with prototypes, which makes them suitable for screening several ideas against one another. Their main weakness is that people are poor at predicting their own behaviour. Stated purchase intentions usually overstate actual purchasing, and the gap varies between products. Jamieson and Bass (1989) compared methods for adjusting stated intentions to predict trial purchase and showed that the raw figures need correction. Morwitz et al. (2007) reviewed the evidence on when intentions predict sales and found that they are more accurate for existing products than for new ones, and over short time horizons than over long ones.
For this reason, experienced researchers rarely read a concept test's "definitely would buy" percentage as a forecast. They compare it with norms: the scores that previous concepts in the same category received, and how those concepts later performed. A concept is judged as strong or weak relative to that history.
Stage 3: Designing the product
When a concept passes screening, research shifts to the details of the design. The question is which combination of features, performance levels and price will create the most value for customers.
Conjoint analysis is the main quantitative tool for this question. Respondents choose between, or rate, product profiles that vary systematically on several attributes, such as battery life, weight, brand and price. From their choices, statistical models estimate how much each attribute level contributes to preference. Green and Srinivasan (1990) review the method's development and its main uses: estimating the value of features, simulating market shares for different product configurations, and setting prices. Conjoint analysis is useful because it forces respondents to trade one attribute against another, which ordinary rating questions do not.
Alongside conjoint work, teams use usability testing and prototype trials. In a usability test, a small number of target users attempt realistic tasks with a prototype while researchers observe where they hesitate, make errors or misunderstand the design. These studies need few participants because their purpose is to find problems, not to estimate how common they are.
Stage 4: Product and market testing
Before a full launch, companies test the finished product with customers. In a home-use test, customers use the product for a period in normal conditions and then report on it. In a blind test, the product is compared with competing products without brand names, to separate reactions to the product from reactions to the brand.
For consumer packaged goods, simulated test markets combine these elements into a sales forecast. Silk and Urban (1978) developed the ASSESSOR model, in which respondents are exposed to advertising, shop in a simulated store containing the new product and its competitors, and are later re-contacted after using the product. The model estimates trial and repeat purchase rates, which together predict long-run market share. Simulated test markets are faster and cheaper than launching in a real test city, and they keep the product out of competitors' sight for longer.
Online businesses can often test in the real market. A software company can release a feature to a small share of users, or show different prices to randomly selected visitors, and measure actual behaviour. These experiments avoid the gap between stated and actual behaviour, but they require a working product and enough traffic to detect differences.
Forecasting adoption
For products that are new to the market rather than new to the company, sales forecasts often use diffusion models. The Bass (1969) model describes how a product spreads through a population of potential adopters. It has two main parameters. The coefficient of innovation (p) reflects adoption driven by external influences such as advertising. The coefficient of imitation (q) reflects adoption driven by the influence of people who have already adopted. When q is larger than p, as it usually is, sales follow a bell-shaped curve: slow at first, rising as adopters influence others, and falling as the market approaches saturation.
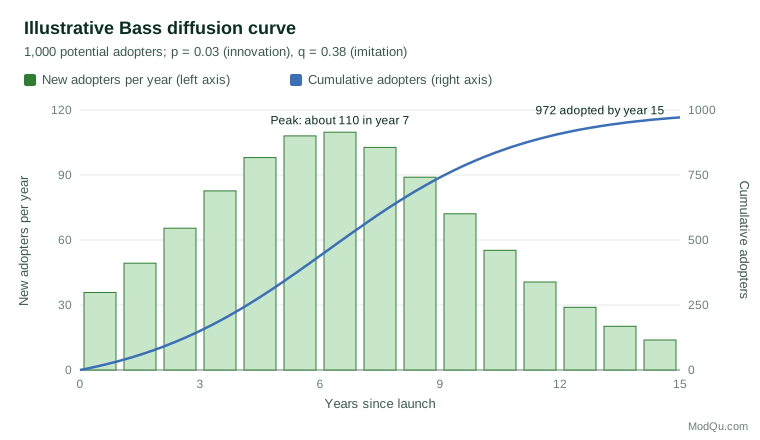
The difficulty is that the parameters cannot be estimated from a product's own sales before launch. Forecasters therefore borrow them from analogous products. Sultan et al. (1990) combined 213 applications of diffusion models and reported average values of about 0.03 for p and 0.38 for q, which are often used as starting points. Mahajan et al. (1990) review the many extensions of the model, including versions that add price and advertising. The market potential, the third input, comes from market sizing research. A diffusion forecast is only as good as the analogy chosen and the estimate of market potential.
Why customers resist new products
Research also helps teams understand why a technically better product may still not sell. Gourville (2006) argues that customers judge a new product against what they already have, and weigh what they would give up more heavily than what they would gain. He suggests that customers overvalue the benefits of the product they already use by a factor of about three, while developers overvalue the benefits of their innovation by a similar factor. The resulting mismatch, which he calls the "9x effect," explains why products that are clearly better on paper can be adopted slowly.
The practical lesson is that research should measure what customers would have to change or give up, such as learning a new system, losing compatibility or abandoning past investments, and not only the benefits they would gain. A product that demands large behavioural change needs a much larger advantage to succeed.
Common mistakes
- Researching too late. Research that arrives after the design is fixed can only confirm or reject; it cannot shape. The early stages, when changes are cheap, are where needs research and concept testing have most value.
- Treating stated intentions as forecasts. Purchase intentions need adjustment and comparison with category norms before they are used to predict sales (Jamieson & Bass, 1989; Morwitz et al., 2007).
- Asking only current customers. Current customers describe today's needs. Lead users and non-customers can reveal where the market is going and why others do not buy (von Hippel, 1986).
- Using research to justify a decision already made. Gates are effective only if a weak result can stop a project. If no result would change the decision, the research budget is better spent elsewhere.
- Ignoring the cost of switching. Measuring the appeal of new features without measuring what customers must give up overstates demand (Gourville, 2006).
Summary
The evidence on new product success points consistently to the same factors: a product that offers customers a real advantage, a clear understanding of their needs, and sound early work before development begins. Each of these depends on research. Needs research and lead user studies identify what to build. Concept tests and conjoint analysis screen ideas and shape the design. Product tests, simulated test markets and live experiments check the finished product. Diffusion models, built on analogies and market sizing, estimate how quickly it will sell. Used at the right stages, these methods allow a company to stop weak projects early and invest in the ones most likely to succeed.
References
Bass, F. M. (1969). A new product growth for model consumer durables. Management Science, 15(5), 215–227. https://doi.org/10.1287/mnsc.15.5.215
Castellion, G., & Markham, S. K. (2013). Perspective: New product failure rates: Influence of argumentum ad populum and self-interest. Journal of Product Innovation Management, 30(5), 976–979.
Christensen, C. M., Hall, T., Dillon, K., & Duncan, D. S. (2016). Know your customers' "jobs to be done." Harvard Business Review, 94(9), 54–62.
Cooper, R. G. (1990). Stage-gate systems: A new tool for managing new products. Business Horizons, 33(3), 44–54. https://doi.org/10.1016/0007-6813(90)90040-I
Cooper, R. G., & Kleinschmidt, E. J. (1987). New products: What separates winners from losers? Journal of Product Innovation Management, 4(3), 169–184. https://doi.org/10.1111/1540-5885.430169
Evanschitzky, H., Eisend, M., Calantone, R. J., & Jiang, Y. (2012). Success factors of product innovation: An updated meta-analysis. Journal of Product Innovation Management, 29(S1), 21–37. https://doi.org/10.1111/j.1540-5885.2012.00964.x
Gourville, J. T. (2006). Eager sellers and stony buyers: Understanding the psychology of new-product adoption. Harvard Business Review, 84(6), 98–106.
Green, P. E., & Srinivasan, V. (1990). Conjoint analysis in marketing: New developments with implications for research and practice. Journal of Marketing, 54(4), 3–19.
Griffin, A., & Hauser, J. R. (1993). The voice of the customer. Marketing Science, 12(1), 1–27. https://doi.org/10.1287/mksc.12.1.1
Henard, D. H., & Szymanski, D. M. (2001). Why some new products are more successful than others. Journal of Marketing Research, 38(3), 362–375.
Jamieson, L. F., & Bass, F. M. (1989). Adjusting stated intention measures to predict trial purchase of new products: A comparison of models and methods. Journal of Marketing Research, 26(3), 336–345. https://doi.org/10.2307/3172905
Lilien, G. L., Morrison, P. D., Searls, K., Sonnack, M., & von Hippel, E. (2002). Performance assessment of the lead user idea-generation process for new product development. Management Science, 48(8), 1042–1059. https://doi.org/10.1287/mnsc.48.8.1042.171
Mahajan, V., Muller, E., & Bass, F. M. (1990). New product diffusion models in marketing: A review and directions for research. Journal of Marketing, 54(1), 1–26. https://doi.org/10.1177/002224299005400101
Montoya-Weiss, M. M., & Calantone, R. (1994). Determinants of new product performance: A review and meta-analysis. Journal of Product Innovation Management, 11(5), 397–417. https://doi.org/10.1111/1540-5885.1150397
Morwitz, V. G., Steckel, J. H., & Gupta, A. (2007). When do purchase intentions predict sales? International Journal of Forecasting, 23(3), 347–364.
Silk, A. J., & Urban, G. L. (1978). Pre-test-market evaluation of new packaged goods: A model and measurement methodology. Journal of Marketing Research, 15(2), 171–191.
Sultan, F., Farley, J. U., & Lehmann, D. R. (1990). A meta-analysis of applications of diffusion models. Journal of Marketing Research, 27(1), 70–77.
Ulrich, K. T., Eppinger, S. D., & Yang, M. C. (2020). Product design and development (7th ed.). McGraw-Hill Education.
Victory, K., Nenycz-Thiel, M., Dawes, J., Tanusondjaja, A., & Corsi, A. M. (2021). How common is new product failure and when does it vary? Marketing Letters, 32(1), 17–32. https://doi.org/10.1007/s11002-021-09555-x
von Hippel, E. (1986). Lead users: A source of novel product concepts. Management Science, 32(7), 791–805. https://doi.org/10.1287/mnsc.32.7.791