
Research · Research design
Exploratory, Descriptive and Causal Research Designs
The three broad families of research design, what each is for, the methods typically used, the conclusions each can and cannot support, and how they combine in a sequence of studies.
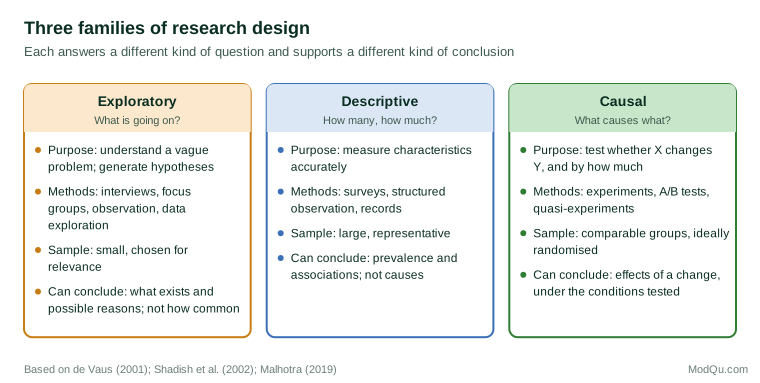
Research designs are often grouped into three families according to what they set out to do. Exploratory research aims to understand a problem that is poorly defined, to generate ideas and hypotheses, and to identify what is worth studying further. Descriptive research aims to measure accurately what exists: how many, how much, how often, and how things vary across groups or over time. Causal, or explanatory, research aims to establish whether one thing produces another and by how much. The classification is old and simple, and it appears in almost every marketing and social research textbook (Malhotra, 2019; Churchill & Iacobucci, 2005). It remains useful because it forces a basic question at the start of any study: what kind of answer is needed? This article describes each family, the methods and standards associated with it, the mistakes that arise when the families are confused, and how they work together.
Why the distinction matters
De Vaus (2001) argued that research design is not the same as method. Design is the logical structure that allows a study to answer its question convincingly; methods are the techniques for collecting and analysing data within that structure. A survey can be part of a descriptive design or part of a causal design, depending on how it is set up. A set of interviews can be exploratory or can form part of a carefully structured comparison. The type of design determines what the study's conclusions can legitimately claim.
Leek and Peng (2015) argued that much confusion in data analysis comes from mistaking one type of question for another, for example treating a descriptive association as if it answered a causal question. Hernán et al. (2019) made the same point in classifying data science tasks into description, prediction and causal inference: each requires different data, different assumptions and different methods, and success at one does not imply success at another.
Exploratory research
Exploratory research is used when little is known, when the problem is not yet clearly defined, or when the researcher wants to discover what the important variables and questions are. Stebbins (2001) described exploration as a broad, purposive and systematic undertaking designed to maximise the discovery of generalisations leading to description and understanding of an area. It is not the same as being casual or unplanned; good exploratory research is carefully designed to be open.
Methods
Typical methods include in-depth interviews, focus groups, observation, case studies, reviews of existing literature and documents, and exploratory analysis of existing data. Tukey (1977) argued for exploratory data analysis as a distinct activity, in which the analyst examines data visually and flexibly to see what it suggests before fitting formal models. Grounded theory, described by Glaser and Strauss (1967), offers a systematic approach to building concepts and explanations from qualitative data.
What it can conclude
Exploratory research produces ideas, concepts, hypotheses and an understanding of the range of views or behaviours that exist. It can show that something happens and suggest why, but it cannot show how common it is or whether it causes anything. Its samples are usually small and chosen for their relevance rather than for statistical representativeness.
Example
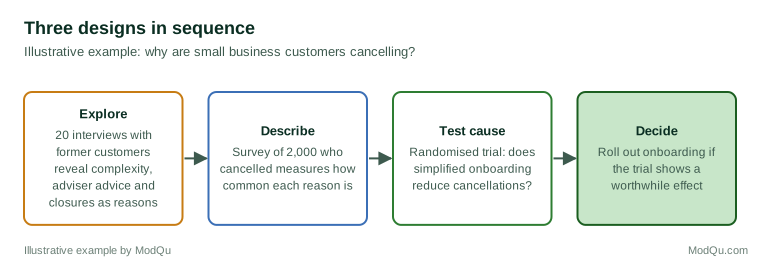
A software company notices that a growing number of small business customers are cancelling within six months. It knows little about why. Exploratory interviews with twenty former customers, chosen to cover different sizes and sectors, reveal several themes: some found the product too complex, some had been persuaded by an accountant to switch, and some had closed their businesses. The interviews do not tell the company how common each reason is, but they tell it what to measure next.
Descriptive research
Descriptive research aims to portray the characteristics of a population or phenomenon accurately. It answers questions such as: what share of customers use the mobile app; how satisfaction differs between regions; how prices have changed over five years. Gerring (2012) argued that description is undervalued in social science compared with causal analysis, despite being the foundation on which causal questions rest. A causal question about why something has changed presupposes an accurate description of what has changed.
Methods
The main methods are surveys, structured observation and the analysis of administrative and transactional data. Descriptive designs can be cross-sectional, measuring a sample at one point in time, or longitudinal, measuring the same population or sample repeatedly to track change.
Standards
Because descriptive research aims to make accurate statements about a population, its key standards concern representativeness and measurement. Groves et al. (2009) described the total survey error framework, which identifies the sources of error that can make a survey estimate differ from the true population value: coverage error (the sampling frame misses part of the population), sampling error (chance variation between samples), nonresponse error (those who respond differ from those who do not), and measurement error (answers differ from the truth because of question wording, mode or respondent behaviour). A good descriptive design minimises each of these within the available budget.
What it can conclude
Descriptive research can establish what exists and how variables are associated. It can show that customers who use the app are more satisfied than those who do not. It cannot, by itself, show that using the app causes higher satisfaction, because satisfied customers might simply be more likely to download the app, or both might be caused by a third factor such as age.
Example
Following its exploratory interviews, the software company surveys a random sample of 2,000 customers who cancelled in the past year, asking about each of the reasons identified. It finds that 35% cite complexity, 20% cite an adviser's recommendation and 15% closed their business (illustrative figures). The company now knows how common each reason is, with a known margin of error.
Causal research
Causal research aims to determine whether a change in one variable produces a change in another. It answers questions such as: does the new onboarding process reduce cancellations; would a lower price increase sales; does training improve productivity?
What causation requires
Holland (1986) set out the logic of causal inference in terms that have become standard. The causal effect of a treatment on a unit is the difference between the outcome the unit would have had with the treatment and the outcome it would have had without it. Because we can never observe both outcomes for the same unit at the same time, Holland called this the fundamental problem of causal inference. Rubin (1974) showed how randomised experiments solve the problem at the level of groups: if units are randomly assigned to treatment and control, the two groups are comparable on average, so the difference in their outcomes estimates the average causal effect.
Shadish et al. (2002) described three conditions that a causal claim must satisfy: the cause must precede the effect, the cause and effect must be related, and alternative explanations must be ruled out. The third condition is the hardest, and it is the reason why causal research needs special designs.
Methods
The strongest causal design is the randomised experiment, including the online controlled experiments, or A/B tests, now used widely by digital businesses (Kohavi et al., 2020). Where randomisation is impossible, researchers use quasi-experimental designs that approximate it, such as comparing changes over time between groups that did and did not receive a treatment, or exploiting natural experiments in which something like random assignment happens by chance. Card and Krueger (1994), for instance, compared employment in fast-food restaurants in New Jersey, which raised its minimum wage, with those in neighbouring Pennsylvania, which did not. Angrist and Pischke (2009) describe the econometric techniques used in such designs.
Causal inference from purely observational data is possible but requires strong assumptions about what has been measured and how variables influence one another. Pearl and Mackenzie (2018) describe how causal diagrams can make these assumptions explicit.
When experiments are impossible
Some causal questions cannot be answered by experiment. No one would randomly assign people to smoke. The case linking smoking to lung cancer was built from observational studies, beginning with the case-control study of Doll and Hill (1950), and strengthened by the accumulation of evidence meeting the considerations later set out by Hill (1965): strength of association, consistency across studies, specificity, temporality, a dose-response gradient, plausibility, coherence, experimental evidence where available, and analogy. These considerations remain a useful guide for judging causal claims in any field where experiments are limited.
Example
The software company suspects that complexity drives cancellations. It randomly assigns half of its new small business customers to a simplified onboarding programme and half to the standard one, and compares cancellation rates after six months. If the simplified group cancels less, and the experiment was well conducted, the company can conclude that the programme caused the reduction.
A sequence, not a choice
The three families are often presented as alternatives, but in practice they form a sequence. Exploration identifies the questions and variables; description measures their prevalence and distribution; causal research tests which factors drive outcomes. The software company example followed exactly this sequence, and each stage would have been weaker without the one before.
The sequence is not rigid. Descriptive findings often raise new exploratory questions. A causal experiment may produce a surprising result that needs exploring. And many studies combine elements of more than one family: a survey can be designed with an embedded experiment, such as randomly varying the price shown to respondents, so that it has both descriptive and causal components.
Common confusions
Treating association as causation
The most common error is drawing causal conclusions from descriptive data. A survey shows that customers who receive the newsletter spend more, and the newsletter is credited with the difference. But customers who sign up for newsletters may already be more engaged. Without a design that rules out this alternative, the causal claim is unsupported.
Generalising from exploratory samples
Exploratory research is designed for depth and range, not for estimating prevalence. Reporting that "60% of participants" in a twelve-person focus group mentioned a theme invites the reader to treat a qualitative finding as a population estimate.
Prediction mistaken for explanation
Shmueli (2010) showed that a model can predict an outcome accurately without identifying its causes. A churn model that flags customers likely to leave is useful for targeting, but its strongest predictors may be symptoms of dissatisfaction rather than causes. Acting on them may not change the outcome.
Description dismissed as trivial
At the other extreme, description is sometimes treated as mere fact-gathering. Gerring (2012) argued that good description is difficult and valuable in its own right. Many business decisions require only accurate description: knowing how large a market is, or how many customers would consider a product, may be all that is needed.
Choosing a design
Yin (2018) suggested that the choice of design depends on the form of the research question, the degree of control the researcher has over events, and whether the focus is on contemporary or historical events. A simpler practical test is to ask what decision the research will inform and what kind of answer that decision needs.
- If the problem is not yet understood, start with exploration.
- If the decision depends on how many or how much, use a descriptive design with a representative sample.
- If the decision depends on what would happen if something were changed, use a causal design, ideally an experiment.
Creswell and Creswell (2018) recommend stating the design explicitly in any research proposal, so that readers can judge whether the planned conclusions match it.
Matching the wording of conclusions to the design
A practical safeguard is to check the verbs in a report against the design that produced the findings. Each family licenses a different vocabulary.
- Exploratory findings support words such as "participants described", "themes included" and "one possible explanation is". They identify what exists and what might matter, not how common it is.
- Descriptive findings support words such as "an estimated 34% of customers", "satisfaction was higher among" and "the share rose from". They report prevalence, differences between groups and change over time, ideally with a margin of error. Groves et al. (2009) stress that such estimates are only as good as the sampling frame, response rate and measurement behind them, so a descriptive claim should state who it describes.
- Causal findings support words such as "caused", "increased", "reduced" and "the effect of". Holland (1986) put the requirement simply: a causal claim compares what happened with what would have happened under a different treatment, so it needs a design that supplies a credible comparison.
Words such as "drives", "leads to", "boosts" and "impact" are causal even when the author did not intend them to be. They appear frequently in reports based on cross-sectional surveys, where the honest wording would be "is associated with". Hernán et al. (2019) recommend the opposite discipline as well: if a study is intended to inform a causal decision, say so, and design and analyse it accordingly, rather than hiding a causal question behind descriptive language.
A short review of this kind, done before a report is released, catches most of the overstatement that leads readers to act on associations as if they were effects.
Conclusion
Exploratory, descriptive and causal designs answer different kinds of question. Exploration generates understanding and hypotheses; description measures what exists with known precision; causal research tests what produces what. Each has its own methods and standards, and each supports a different kind of conclusion. Most problems in applied research arise not from choosing the wrong method but from asking a design to deliver an answer it cannot give. Being clear at the outset about which kind of answer is needed, and planning a sequence of studies where necessary, is the simplest way to avoid that mistake.
References
Angrist, J. D., & Pischke, J.-S. (2009). Mostly harmless econometrics: An empiricist's companion. Princeton University Press.
Card, D., & Krueger, A. B. (1994). Minimum wages and employment: A case study of the fast-food industry in New Jersey and Pennsylvania. American Economic Review, 84(4), 772–793.
Churchill, G. A., Jr., & Iacobucci, D. (2005). Marketing research: Methodological foundations (9th ed.). Thomson South-Western.
Creswell, J. W., & Creswell, J. D. (2018). Research design: Qualitative, quantitative, and mixed methods approaches (5th ed.). SAGE.
de Vaus, D. A. (2001). Research design in social research. SAGE.
Doll, R., & Hill, A. B. (1950). Smoking and carcinoma of the lung: Preliminary report. British Medical Journal, 2(4682), 739–748. https://doi.org/10.1136/bmj.2.4682.739
Gerring, J. (2012). Mere description. British Journal of Political Science, 42(4), 721–746. https://doi.org/10.1017/S0007123412000130
Glaser, B. G., & Strauss, A. L. (1967). The discovery of grounded theory: Strategies for qualitative research. Aldine.
Groves, R. M., Fowler, F. J., Jr., Couper, M. P., Lepkowski, J. M., Singer, E., & Tourangeau, R. (2009). Survey methodology (2nd ed.). Wiley.
Hernán, M. A., Hsu, J., & Healy, B. (2019). A second chance to get causal inference right: A classification of data science tasks. CHANCE, 32(1), 42–49. https://doi.org/10.1080/09332480.2019.1579578
Hill, A. B. (1965). The environment and disease: Association or causation? Proceedings of the Royal Society of Medicine, 58(5), 295–300. https://doi.org/10.1177/003591576505800503
Holland, P. W. (1986). Statistics and causal inference. Journal of the American Statistical Association, 81(396), 945–960. https://doi.org/10.1080/01621459.1986.10478354
Kohavi, R., Tang, D., & Xu, Y. (2020). Trustworthy online controlled experiments: A practical guide to A/B testing. Cambridge University Press.
Leek, J. T., & Peng, R. D. (2015). What is the question? Science, 347(6228), 1314–1315. https://doi.org/10.1126/science.aaa6146
Malhotra, N. K. (2019). Marketing research: An applied orientation (7th ed.). Pearson.
Pearl, J., & Mackenzie, D. (2018). The book of why: The new science of cause and effect. Basic Books.
Rubin, D. B. (1974). Estimating causal effects of treatments in randomized and nonrandomized studies. Journal of Educational Psychology, 66(5), 688–701. https://doi.org/10.1037/h0037350
Shadish, W. R., Cook, T. D., & Campbell, D. T. (2002). Experimental and quasi-experimental designs for generalized causal inference. Houghton Mifflin.
Shmueli, G. (2010). To explain or to predict? Statistical Science, 25(3), 289–310. https://doi.org/10.1214/10-STS330
Stebbins, R. A. (2001). Exploratory research in the social sciences. SAGE.
Tukey, J. W. (1977). Exploratory data analysis. Addison-Wesley.
Yin, R. K. (2018). Case study research and applications: Design and methods (6th ed.). SAGE.