
Research · Market and business research
Customer Journey Research
What customer journey research is, the frameworks behind it, the qualitative, quantitative and behavioural methods used to study journeys, and what the evidence says about how to map and improve them.
A customer rarely experiences a company through a single interaction. Buying a mobile phone plan may involve an online search, a comparison site, a visit to a store, a credit check, a delivery, an activation call and, months later, a first bill. Each of these is a touchpoint, and the sequence of touchpoints from first awareness to repurchase or exit is the customer journey. Customer journey research is the set of methods used to describe that sequence, measure how customers experience it, and find the points where it succeeds or fails. This article explains the main frameworks, the methods used at each stage of a journey study, and what published research says about doing it well.
Why journeys rather than touchpoints
Traditional customer research often measured each touchpoint separately: satisfaction with the call centre, satisfaction with the website, satisfaction with delivery. The case for studying journeys is that customers judge the whole sequence, and a series of acceptable steps can still add up to a poor experience if hand-offs fail or the customer has to repeat information.
Rawson et al. (2013), drawing on McKinsey research across several industries, reported that performance on whole journeys was 30% to 40% more strongly correlated with customer satisfaction than performance on individual touchpoints, and 20% to 30% more strongly correlated with business outcomes such as repurchase and lower churn. Their argument was that most companies perform reasonably well at individual touchpoints, so the differences between competitors lie in how well the touchpoints fit together.
Academic research reached a similar position. Verhoef et al. (2009) described customer experience as holistic, involving the customer's cognitive, emotional, social and physical responses, and shaped by factors the company does not control, such as other customers. Lemon and Verhoef (2016), in a widely cited review, defined customer experience as a multidimensional construct that develops across the entire journey and argued that firms must understand it from the customer's point of view rather than through their own channel structure. Hamilton and Price (2019), introducing a journal special issue on consumer journeys, called for strategy to be built around the journeys consumers actually take.
Frameworks for describing a journey
Several frameworks give journey research a common structure.
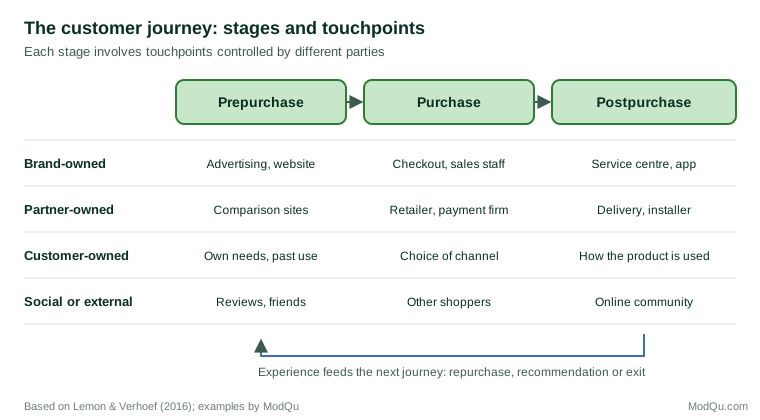
Stages and touchpoint ownership. Lemon and Verhoef (2016) divide the journey into three stages: prepurchase (recognising a need, searching and considering options), purchase (choosing, ordering and paying) and postpurchase (use, service, repurchase or exit). They also classify touchpoints by who controls them: brand-owned (advertising, website, staff), partner-owned (retailers, delivery firms, agencies), customer-owned (the customer's own actions and choices) and social or external (other customers, reviews, media). The second dimension is important for research design, because many influential touchpoints are outside the company's own data systems.
The consumer decision journey. Court et al. (2009) proposed replacing the linear purchase funnel with a loop of four phases: initial consideration, active evaluation, closure (purchase) and a postpurchase experience that feeds back into the next decision. In their survey of buyers across several categories, the number of brands under consideration often grew during active evaluation rather than shrinking as the funnel model assumes, and about two-thirds of the touchpoints during active evaluation were driven by consumers themselves, such as reviews and word of mouth, rather than by marketers.
Service blueprints. Journey maps show the customer's side of the experience. Service blueprints, introduced by Shostack (1984) and developed by Bitner et al. (2008), add what happens behind it. A blueprint lays out the customer's actions alongside the actions of front-line staff, back-office staff and support systems, separated by a "line of interaction" and a "line of visibility". Blueprints are useful when the cause of a journey problem lies in internal processes the customer never sees.
Planned versus actual journeys. Halvorsrud et al. (2016) distinguish the journey a company has designed from the journey customers actually take. In a study of a telecommunications service, they recorded real customer journeys and compared them with the planned journey; the deviations, such as missing or delayed messages and steps out of order, pointed directly to service quality problems.
Methods across a journey study
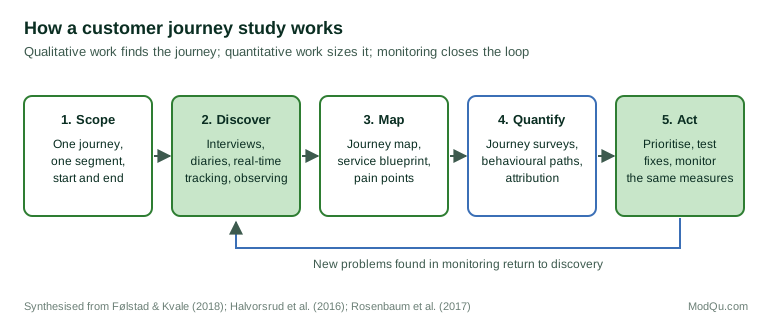
Customer journey research is not a single method. Følstad and Kvale (2018), in a systematic review, found that the term is used in several different ways and that studies combine many techniques. Tueanrat et al. (2021) reached a similar conclusion in a later review of the literature. In practice, a journey study usually moves through the phases shown in Figure 2, with different methods suited to each.
1. Scope the journey
A company has many journeys: buying, onboarding, getting help, upgrading, complaining, cancelling. Studies work best when they focus on one journey for one customer segment, with a clear start and end point. Edelman and Singer (2015) recommend that firms identify the small number of journeys that matter most to customers and to the business, and organise improvement around them.
2. Discover with qualitative research
The first task is to learn what the journey actually consists of from the customer's side. Common methods include:
- In-depth interviews in which customers reconstruct a recent journey step by step, including what they did, where they looked, whom they asked and how they felt.
- Diary studies, in which participants record their experiences as they happen over days or weeks. Diaries reduce reliance on memory and capture events that interviews miss (Bolger et al., 2003).
- Observation and accompanied shopping, which show behaviour customers may not think to mention.
- Mystery shopping and staff interviews, which reveal how the journey works from inside the organisation and supply material for a service blueprint.
A related technique is real-time experience tracking, in which participants send a short structured message, often by mobile phone, each time they encounter a brand: which touchpoint it was, how positive it felt and whether it made them more likely to buy (Macdonald et al., 2012). Baxendale et al. (2015) used this method across four product categories to measure six types of touchpoint at once. They found that the positivity of in-store communication had more influence on brand consideration than brand advertising, that observing other customers using a product was a consistently significant touchpoint, and that how customers felt about a touchpoint added explanatory power beyond simply counting exposures.
3. Map the journey
The findings are assembled into a journey map: a visual sequence of stages and touchpoints, usually showing customer goals, actions, thoughts, emotions and pain points at each step. Rosenbaum et al. (2017) criticised many maps for assuming that every customer passes through the same touchpoints and that each touchpoint is equally important. In a shopping mall case study, they showed that customer research could be used to rank touchpoints by importance, and that this changed where management chose to invest. A good map therefore rests on evidence from real customers, distinguishes segments where journeys differ, and indicates which steps matter most.
4. Quantify with surveys and behavioural data
Qualitative work shows what can happen. Quantitative work shows how often it happens and how much it matters.
Journey surveys ask customers who recently completed a journey to rate each stage and the journey overall. Analysing which stage ratings best predict the overall rating, or later behaviour, indicates where to act. Survey design should take account of how memory works: Redelmeier and Kahneman (1996) found that patients' later evaluations of a painful procedure depended heavily on its worst moment and on how it ended, while its duration had little effect. Retrospective journey ratings are likely to show similar distortions, which is one reason to combine them with in-the-moment measures.
Measures of effort are often more useful than measures of delight. Dixon et al. (2010) reported that reducing the effort customers must make to solve a problem, such as repeat contacts and transfers, was more closely linked to loyalty than exceeding expectations. Single summary metrics have limits: Keiningham et al. (2007) found that the Net Promoter Score did not predict revenue growth better than customer satisfaction measures in their Norwegian data.
Behavioural data from websites, apps, call centres and transaction systems records what customers actually did. Linking these records by customer allows researchers to reconstruct paths at scale, measure drop-off between steps and compare the paths of customers who converted with those who did not. In digital marketing this work is known as attribution modelling: estimating how much each channel contributed to a sale. Li and Kannan (2014) built a model of multichannel online journeys and tested it with a field experiment, showing that simple rules such as giving all credit to the last click misstate channel contributions. Anderl et al. (2016) modelled journeys as paths through a network of channels using four large datasets and found that the results differed considerably from last-click attribution, with notable carry-over and interaction effects between channels.
Behavioural data have blind spots. They capture brand-owned digital touchpoints well but miss most partner-owned, customer-owned and social touchpoints, such as a conversation with a friend or a visit to a competitor's store. Surveys and qualitative research are needed to cover these.
5. Prioritise and monitor
The last phase turns findings into action. Problems are prioritised by how many customers they affect, how much they matter to the overall experience and to business outcomes, and how costly they are to fix. Improvements are then tracked with the same measures used to diagnose them. Edelman and Singer (2015) argue that the most advanced firms treat journeys as products to be continually redesigned, using data to personalise and automate steps.
What makes a journey work
Research has begun to identify the properties of well-designed journeys. Kuehnl et al. (2019), using survey data from 4,814 consumers in two countries, defined effective customer journey design as the degree to which customers see a brand's touchpoints as thematically cohesive (sharing a common theme), consistent (uniform in look and behaviour) and context-sensitive (suited to the customer's situation at that moment). Effective journey design was associated with greater loyalty through its effect on attitudes to the brand. These three dimensions can be built directly into journey surveys.
Organisational capability also matters. Homburg et al. (2017), drawing on interviews with 52 managers, described customer experience management as combining a cultural mindset focused on experiences, strategic direction for designing them, and the capability to keep renewing them. Kranzbühler et al. (2018) noted that research has tended to study experience either from the organisation's or the consumer's perspective, and either at a single point or over time, and argued that the perspectives need to be connected. For practitioners, the implication is that a journey map is only useful if someone owns the journey and has the authority to change the touchpoints across departments.
Common pitfalls
- Mapping from the inside out. Maps built in workshops from staff assumptions describe the planned journey, not the actual one (Halvorsrud et al., 2016).
- One map for everyone. Different segments take different routes. A single average journey can hide the problems of the customers most at risk of leaving.
- Treating all touchpoints as equal. Without evidence on importance, effort is spread too thinly (Rosenbaum et al., 2017).
- Ignoring touchpoints the firm does not own. Reviews, peers and partners can shape decisions more than the company's own messages (Baxendale et al., 2015; Court et al., 2009).
- Over-trusting last-click data. Behavioural data show the final step clearly and earlier influences poorly (Anderl et al., 2016).
- Mapping without action. A map that is not tied to measures, owners and decisions becomes a poster.
A practical example
Consider a home insurer that wants to reduce cancellations in the first year. The research team scopes the study to the onboarding journey for new online customers. Interviews with recent buyers and a two-week diary study reveal that many customers are uncertain whether their policy is active, because the welcome documents arrive days after payment. A service blueprint shows that documents are generated by a batch process overnight and posted by a partner. Linked behavioural data confirm that customers who telephone in the first week, often to ask whether they are covered, are more likely to cancel. A survey of new customers measures effort and confidence at each stage. The team recommends an immediate confirmation message with the policy summary, tests it against the existing process with a randomly assigned group of new customers, and monitors early contact and cancellation rates.
Each element of the study answers a different question: the qualitative work identifies the problem, the blueprint explains its cause, the behavioural data size it, the survey measures how customers feel, and the experiment tests the fix.
Summary
Customer journey research studies experience as customers live it: as a sequence of touchpoints across stages, many of them outside the company's control. Its value comes from combining methods: qualitative research to discover the real journey, maps and blueprints to structure it, surveys and behavioural data to measure it, and experiments to test improvements. The evidence suggests that journeys explain customer outcomes better than isolated touchpoints, that maps should be built from customer evidence rather than internal assumptions, and that cohesive, consistent and context-sensitive journeys are linked to loyalty.
References
Anderl, E., Becker, I., von Wangenheim, F., & Schumann, J. H. (2016). Mapping the customer journey: Lessons learned from graph-based online attribution modeling. International Journal of Research in Marketing, 33(3), 457–474. https://doi.org/10.1016/j.ijresmar.2016.03.001
Baxendale, S., Macdonald, E. K., & Wilson, H. N. (2015). The impact of different touchpoints on brand consideration. Journal of Retailing, 91(2), 235–253. https://doi.org/10.1016/j.jretai.2014.12.008
Bitner, M. J., Ostrom, A. L., & Morgan, F. N. (2008). Service blueprinting: A practical technique for service innovation. California Management Review, 50(3), 66–94. https://doi.org/10.2307/41166446
Bolger, N., Davis, A., & Rafaeli, E. (2003). Diary methods: Capturing life as it is lived. Annual Review of Psychology, 54, 579–616.
Court, D., Elzinga, D., Mulder, S., & Vetvik, O. J. (2009). The consumer decision journey. McKinsey Quarterly, (3), 96–107.
Dixon, M., Freeman, K., & Toman, N. (2010). Stop trying to delight your customers. Harvard Business Review, 88(7/8), 116–122.
Edelman, D. C., & Singer, M. (2015). Competing on customer journeys. Harvard Business Review, 93(11), 88–100.
Følstad, A., & Kvale, K. (2018). Customer journeys: A systematic literature review. Journal of Service Theory and Practice, 28(2), 196–227. https://doi.org/10.1108/JSTP-11-2014-0261
Halvorsrud, R., Kvale, K., & Følstad, A. (2016). Improving service quality through customer journey analysis. Journal of Service Theory and Practice, 26(6), 840–867. https://doi.org/10.1108/JSTP-05-2015-0111
Hamilton, R., & Price, L. L. (2019). Consumer journeys: Developing consumer-based strategy. Journal of the Academy of Marketing Science, 47(2), 187–191. https://doi.org/10.1007/s11747-019-00636-y
Homburg, C., Jozić, D., & Kuehnl, C. (2017). Customer experience management: Toward implementing an evolving marketing concept. Journal of the Academy of Marketing Science, 45(3), 377–401. https://doi.org/10.1007/s11747-015-0460-7
Keiningham, T. L., Cooil, B., Andreassen, T. W., & Aksoy, L. (2007). A longitudinal examination of net promoter and firm revenue growth. Journal of Marketing, 71(3), 39–51. https://doi.org/10.1509/jmkg.71.3.039
Kranzbühler, A.-M., Kleijnen, M. H. P., Morgan, R. E., & Teerling, M. (2018). The multilevel nature of customer experience research: An integrative review and research agenda. International Journal of Management Reviews, 20(2), 433–456. https://doi.org/10.1111/ijmr.12140
Kuehnl, C., Jozic, D., & Homburg, C. (2019). Effective customer journey design: Consumers' conception, measurement, and consequences. Journal of the Academy of Marketing Science, 47(3), 551–568. https://doi.org/10.1007/s11747-018-00625-7
Lemon, K. N., & Verhoef, P. C. (2016). Understanding customer experience throughout the customer journey. Journal of Marketing, 80(6), 69–96. https://doi.org/10.1509/jm.15.0420
Li, H., & Kannan, P. K. (2014). Attributing conversions in a multichannel online marketing environment: An empirical model and a field experiment. Journal of Marketing Research, 51(1), 40–56. https://doi.org/10.1509/jmr.13.0050
Macdonald, E. K., Wilson, H. N., & Konuş, U. (2012). Better customer insight—in real time. Harvard Business Review, 90(9), 102–108.
Rawson, A., Duncan, E., & Jones, C. (2013). The truth about customer experience. Harvard Business Review, 91(9), 90–98.
Redelmeier, D. A., & Kahneman, D. (1996). Patients' memories of painful medical treatments: Real-time and retrospective evaluations of two minimally invasive procedures. Pain, 66(1), 3–8. https://doi.org/10.1016/0304-3959(96)02994-6
Rosenbaum, M. S., Otalora, M. L., & Ramírez, G. C. (2017). How to create a realistic customer journey map. Business Horizons, 60(1), 143–150. https://doi.org/10.1016/j.bushor.2016.09.010
Shostack, G. L. (1984). Designing services that deliver. Harvard Business Review, 62(1), 133–139.
Tueanrat, Y., Papagiannidis, S., & Alamanos, E. (2021). Going on a journey: A review of the customer journey literature. Journal of Business Research, 125, 336–353. https://doi.org/10.1016/j.jbusres.2020.12.028
Verhoef, P. C., Lemon, K. N., Parasuraman, A., Roggeveen, A., Tsiros, M., & Schlesinger, L. A. (2009). Customer experience creation: Determinants, dynamics and management strategies. Journal of Retailing, 85(1), 31–41. https://doi.org/10.1016/j.jretai.2008.11.001