
Investigation · Foundations
Investigative Sampling: Choosing Records, Cases, and Sources
Investigators rarely examine everything. This article explains how to choose which transactions, documents, cases and people to examine, when statistical sampling is needed, when judgment is better, and how to avoid conclusions that the sample cannot support.
A fraud examiner faced with five years of payment records, an internal investigator with a million emails, or a journalist trying to understand a pattern of complaints cannot read every item with equal care. Choosing what to examine is one of the first and most consequential decisions in an investigation. Choose well, and a manageable amount of work reveals what happened and how widespread it was. Choose badly, and the investigation either misses the problem altogether or draws conclusions about the whole from a part that does not represent it.
Sampling is often associated with surveys and audits, but it is central to investigation too. This article explains the main purposes of investigative sampling, the difference between statistical and judgmental selection, some practical techniques, and the errors that most often undermine conclusions drawn from samples.
Why investigators sample
Investigators select from a larger set of items for three different purposes, and the right method depends on which one applies.
- To find something. The aim is to discover whether a problem exists at all: whether there are any fictitious suppliers, any falsified timesheets, any emails discussing a price-fixing arrangement. Here the investigator wants to maximise the chance of finding examples, and a sample that targets the most suspicious items is often best.
- To measure something. The aim is to estimate how common or how large a problem is: what proportion of claims were inflated, or how much money was lost. Here the sample must be representative, so that results can be projected to the whole population with a known margin of error.
- To understand something. The aim is to learn how a process works, how a scheme operated or how people experienced an event. Here the investigator chooses cases or sources that are especially informative, much as a qualitative researcher does.
Confusing these purposes is a common source of error. A targeted sample chosen to find problems will overstate how common they are if its results are projected to the population. A random sample chosen to measure prevalence may contain no examples of a rare but serious problem.
Statistical sampling
Statistical sampling uses random selection, so that every item in the population has a known chance of being chosen. That property allows the results to be generalised with a measurable level of confidence (Cochran, 1977; Kish, 1965; Lohr, 2019). Auditing standards describe statistical sampling as an approach that uses random selection and probability theory to evaluate results and measure sampling risk (International Auditing and Assurance Standards Board [IAASB], 2009; Public Company Accounting Oversight Board [PCAOB], n.d.).
Attribute sampling
Attribute sampling estimates the proportion of items that have a characteristic, such as a missing approval or an incorrect calculation. The investigator draws a random sample, counts the exceptions and calculates the rate and its confidence interval. Auditors use it to test whether controls operate as intended (Guy et al., 2002).
Monetary unit sampling
When the aim is to estimate the value of misstatement, auditors often use monetary unit sampling, in which each dollar rather than each transaction has an equal chance of selection. Larger items are therefore more likely to be chosen, which suits investigations where large errors matter most (Guy et al., 2002; Elder et al., 2013).
Discovery sampling
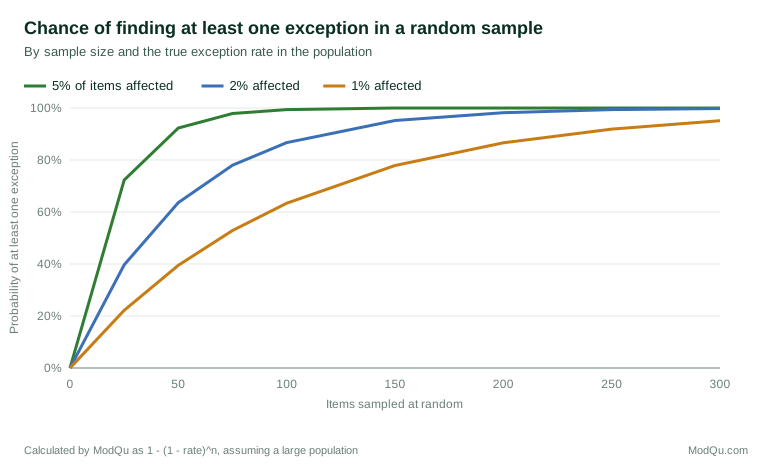
Discovery sampling answers a specific question: how many items must be examined to have a given chance of finding at least one exception if the exception rate is at least a certain level? If exceptions occur in 1% of items, a random sample of about 300 gives a 95% chance of including at least one. If they occur in 5% of items, about 60 are enough. Conversely, if a random sample of a given size contains no exceptions at all, the investigator can state an upper limit on the likely rate. A widely used approximation, sometimes called the rule of three, is that zero exceptions in a sample of n items gives an approximate 95% upper bound of 3/n on the true rate (Hanley & Lippman-Hand, 1983). A clean sample of 300 therefore suggests that the rate is probably below 1%, not that it is zero.
Judgmental and targeted selection
Statistical sampling is not always the best tool. When the aim is to find wrongdoing rather than to measure it, investigators usually do better by selecting the items most likely to be problematic. Typical targeting criteria include:
- payments just below an approval threshold;
- round-number amounts, duplicates and payments on weekends or holidays;
- new suppliers with addresses or bank accounts that match employees;
- journal entries posted late at night, by unusual users or to rarely used accounts;
- transactions involving people or units already under suspicion.
Targeted selection is efficient, but it has an important limitation: its results cannot be projected statistically to the population. If 12 of 40 targeted payments are fraudulent, that does not mean 30% of all payments are. Auditing standards and research both warn that "haphazard" selection, choosing items without a conscious bias but without true randomness, also produces samples that are not representative. Hall et al. (2001) found that people asked to select items haphazardly systematically favoured some kinds of items over others, and that increasing the sample size did not remove the bias.
A common and effective approach combines both methods: targeted selection to find and understand the problem, followed by random sampling, or full-population testing, to measure its extent.
Full-population testing and data analytics
Modern data tools allow investigators to test every transaction against defined rules: every payment matched to a purchase order, every supplier bank account compared with the payroll file, every expense claim checked for duplicates. Where data are available electronically, testing the whole population is often more reliable and no more expensive than sampling. The results are then used to select items for detailed review.
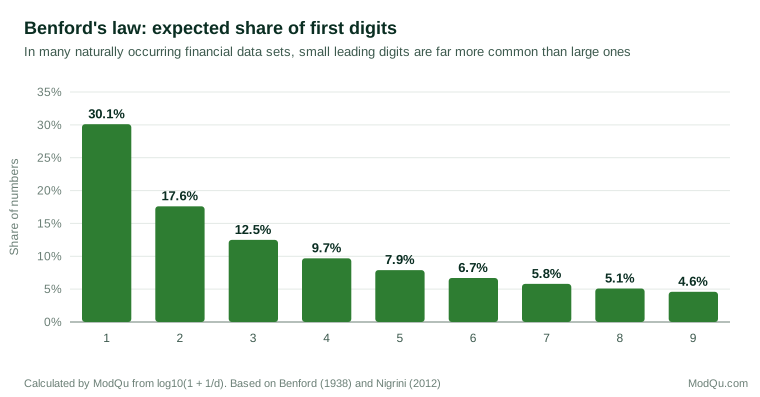
One well-known analytical technique is digit analysis based on Benford's law. In many naturally occurring sets of numbers, the first digit is more often small than large: about 30% of numbers begin with 1, and fewer than 5% begin with 9 (Benford, 1938; Hill, 1995). Accounting data generated by real transactions often follow this pattern, while invented figures often do not, because people tend to spread digits more evenly. Nigrini and Mittermaier (1997) and Nigrini (2012) describe how auditors and fraud examiners use deviations from Benford's law to flag accounts or individuals for further inquiry. Durtschi et al. (2004) caution that the method only works for data that should follow the distribution, and that a deviation is a reason to look, not evidence of fraud.
Sampling documents in electronic discovery
Large investigations and litigation can involve millions of documents. Technology-assisted review, in which software trained on a reviewer's decisions ranks documents by likely relevance, is now widely used. Grossman and Cormack (2011) found that technology-assisted review could identify relevant documents at least as effectively as exhaustive manual review, at a fraction of the effort. A United States federal court approved its use in Da Silva Moore v. Publicis Groupe (2012). Sampling plays a central role in validating such reviews: random samples of documents the system has excluded are checked to estimate how many relevant documents were missed. Without that step, there is no way to know whether the review found most of what mattered.
Choosing cases and sources
Investigators also select cases, sites and people to examine. A regulator reviewing a firm's sales practices may choose a handful of branches. A journalist examining a pattern of complaints may choose a few cases to investigate in depth. A workplace investigator may decide which colleagues to interview.
Qualitative researchers have developed useful guidance for such choices. Patton (2015) describes purposeful sampling strategies, including selecting extreme or deviant cases, typical cases, and cases that are critical for testing a claim. Seawright and Gerring (2008) set out case selection techniques for case study research and show how choices such as typical, diverse, extreme, deviant and most-similar cases support different kinds of conclusion. An investigator who selects only the most dramatic cases can learn a great deal about how a scheme worked but should not claim that those cases are typical.
When the people with relevant information are hard to identify, investigators often use referral: each witness is asked who else should be spoken to. Biernacki and Waldorf (1981) describe the strengths and limitations of this snowball approach, and Heckathorn (1997) developed respondent-driven sampling as a way of drawing statistical conclusions from referral chains under certain conditions. In an investigation, referral is useful for finding sources, but the investigator should remember that each referral reflects the referrer's networks and perspective, so that some viewpoints may never be reached.
Errors that undermine conclusions
Selection bias
The most serious error is drawing general conclusions from a sample that differs systematically from the population. A classic illustration comes from the Second World War, when the statistician Abraham Wald analysed damage on returning aircraft. The natural conclusion was to reinforce the areas most often hit. Wald recognised that the sample consisted only of aircraft that had survived, so the areas with few hits on returning aircraft were probably where hits were fatal (Mangel & Samaniego, 1984). Investigators face the same trap when they examine only complaints that were escalated, frauds that were detected or cases that reached court. Heckman (1979) formalised how such selection can bias estimates of relationships as well as levels.
Projecting a targeted sample
As noted above, results from a targeted selection describe the items selected, not the population. Reports should say clearly how items were chosen and avoid language that implies a general rate unless the sample supports it.
Treating absence in a sample as absence in the population
A sample with no exceptions shows only that the rate is probably below some level. Unless the sample is large or the whole population has been tested, the investigator should report the upper bound, not a finding that no problem exists.
Ignoring how detection shapes the record
Data about past cases reflect how cases were detected as well as how often they occurred. The Association of Certified Fraud Examiners (2024) reports that tips are the most common way occupational frauds are detected. Frauds that nobody reports, and that controls do not catch, are under-represented in any sample of known cases, which means that studies of detected fraud describe the frauds that were found, not necessarily the frauds that exist.
How large should a sample be?
For estimating a proportion from a random sample, the precision of the estimate depends mainly on the number of items examined, not on the size of the population, provided the sample is a small fraction of it. A sample of about 400 items gives a 95% confidence interval of roughly plus or minus five percentage points around an estimated rate of 50%, and a narrower interval when the rate is close to zero or one (Cochran, 1977; Lohr, 2019). Halving the width of the interval requires roughly four times as many items. For low exception rates, which are common in investigations, the interval is narrower in absolute terms but wide relative to the rate itself, so an estimate of "2%" from a few hundred items may be consistent with a true rate anywhere from below 1% to above 3%.
When the population is divided into groups that differ in risk or value, such as small and large payments or different business units, stratified sampling improves efficiency. Items are sampled separately within each group, often with more items from the groups that matter most, and the results are combined with appropriate weights. Stratification also ensures that small but important groups are not missed by chance (Kish, 1965).
A worked example
Consider a hypothetical investigation into suspected manipulation of supplier invoices at a company that processed 48,000 invoices over three years. The investigator first tests the whole population electronically. Rules flag 1,250 invoices: duplicates, invoices from suppliers sharing a bank account with an employee, invoices just under the approval limit and invoices with unusual first-digit patterns for particular approvers. The investigator then examines 120 of the flagged invoices in detail, chosen to cover every rule and every approver involved. Thirty-one are found to be improper.
Those 31 cases establish that manipulation occurred, show how it was done and identify who was involved. They do not show how much of the whole population was affected. To estimate that, the investigator draws a random sample of 400 invoices from the 46,750 that were not flagged and finds two improper ones. The estimated rate among unflagged invoices is therefore 0.5%, with a one-sided 95% upper bound of roughly 1.6%. Combining the two parts of the work, the investigator can report the confirmed cases, an estimate of the additional improper invoices likely to exist among those not flagged, and the uncertainty around that estimate. The report can also state which kinds of manipulation the rules would and would not detect, so that readers understand the limits of the work.
Documenting the selection
Whatever method is used, the selection should be documented well enough that someone else could repeat it. The record should include the definition of the population, the source and date of the data, any rules or criteria used to flag or target items, the method and seed used for random selection, the sample size and the reason for it, and the results for each item. Without this record, the findings cannot be checked and the conclusions cannot be defended. Auditing standards make similar requirements for audit samples (IAASB, 2009).
A practical sequence
The following sequence works for many investigations involving large volumes of records:
- State the purpose: to find, to measure, or to understand.
- Define the population precisely: which records, from when to when, and from which systems.
- Test the whole population electronically where possible, using rules and analytics to flag unusual items.
- Examine flagged items in detail to find and understand problems.
- Draw a random sample to estimate the extent of the problem, if a measure is needed.
- Document the selection method, sample sizes and results, so that others can assess what the sample can and cannot show.
- Report findings in terms that match the method: "of the 40 payments examined" for targeted samples, and an estimate with a confidence interval for random ones.
Conclusion
Every investigation is built on a selection of evidence, whether or not the investigator thinks of it as sampling. Being explicit about why items were chosen, and matching the method to the purpose, makes the difference between findings that can be relied upon and findings that only describe the part of the picture the investigator happened to look at. The same discipline that makes a survey trustworthy, a clear population, a known selection process and honest statements of uncertainty, makes an investigation trustworthy too.
References
Association of Certified Fraud Examiners. (2024). Occupational fraud 2024: A report to the nations. https://www.acfe.com/RTTN
Benford, F. (1938). The law of anomalous numbers. Proceedings of the American Philosophical Society, 78(4), 551–572.
Biernacki, P., & Waldorf, D. (1981). Snowball sampling: Problems and techniques of chain referral sampling. Sociological Methods & Research, 10(2), 141–163. https://doi.org/10.1177/004912418101000205
Cochran, W. G. (1977). Sampling techniques (3rd ed.). Wiley.
Da Silva Moore v. Publicis Groupe, 287 F.R.D. 182 (S.D.N.Y. 2012).
Durtschi, C., Hillison, W., & Pacini, C. (2004). The effective use of Benford's law to assist in detecting fraud in accounting data. Journal of Forensic Accounting, 5, 17–34.
Elder, R. J., Akresh, A. D., Glover, S. M., Higgs, J. L., & Liljegren, J. (2013). Audit sampling research: A synthesis and implications for future research. Auditing: A Journal of Practice & Theory, 32(Suppl. 1), 99–129. https://doi.org/10.2308/ajpt-50394
Grossman, M. R., & Cormack, G. V. (2011). Technology-assisted review in e-discovery can be more effective and more efficient than exhaustive manual review. Richmond Journal of Law and Technology, 17(3), Article 11.
Guy, D. M., Carmichael, D. R., & Whittington, O. R. (2002). Audit sampling: An introduction (5th ed.). Wiley.
Hall, T. W., Herron, T. L., Pierce, B. J., & Witt, T. J. (2001). The effectiveness of increasing sample size to mitigate the influence of population characteristics in haphazard sampling. Auditing: A Journal of Practice & Theory, 20(1), 169–185. https://doi.org/10.2308/aud.2001.20.1.169
Hanley, J. A., & Lippman-Hand, A. (1983). If nothing goes wrong, is everything all right? Interpreting zero numerators. JAMA, 249(13), 1743–1745. https://doi.org/10.1001/jama.1983.03330370053031
Heckathorn, D. D. (1997). Respondent-driven sampling: A new approach to the study of hidden populations. Social Problems, 44(2), 174–199. https://doi.org/10.2307/3096941
Heckman, J. J. (1979). Sample selection bias as a specification error. Econometrica, 47(1), 153–161. https://doi.org/10.2307/1912352
Hill, T. P. (1995). A statistical derivation of the significant-digit law. Statistical Science, 10(4), 354–363. https://doi.org/10.1214/ss/1177009869
International Auditing and Assurance Standards Board. (2009). International Standard on Auditing 530: Audit sampling. International Federation of Accountants.
Kish, L. (1965). Survey sampling. Wiley.
Lohr, S. L. (2019). Sampling: Design and analysis (2nd ed.). CRC Press.
Mangel, M., & Samaniego, F. J. (1984). Abraham Wald's work on aircraft survivability. Journal of the American Statistical Association, 79(386), 259–267. https://doi.org/10.1080/01621459.1984.10478038
Nigrini, M. J. (2012). Benford's law: Applications for forensic accounting, auditing, and fraud detection. Wiley.
Nigrini, M. J., & Mittermaier, L. J. (1997). The use of Benford's law as an aid in analytical procedures. Auditing: A Journal of Practice & Theory, 16(2), 52–67.
Patton, M. Q. (2015). Qualitative research and evaluation methods (4th ed.). Sage.
Public Company Accounting Oversight Board. (n.d.). AS 2315: Audit sampling. PCAOB.
Seawright, J., & Gerring, J. (2008). Case selection techniques in case study research: A menu of qualitative and quantitative options. Political Research Quarterly, 61(2), 294–308. https://doi.org/10.1177/1065912907313077