
Intelligence · Market and competitive intelligence
Supply Chain Intelligence and Risk Monitoring
Modern supply chains are long, global and fragile. This article explains how supply chain intelligence works, why information gets distorted as it moves along a chain, how to map and rank supply risks and how to set up monitoring that gives early warning of disruption.
A modern product may contain parts from dozens of countries, pass through several factories and travel thousands of kilometres before it reaches a customer. Each link in that chain is a point where something can go wrong: a fire at a supplier, a strike at a port, a new export restriction, a supplier's financial collapse or a sudden swing in demand. The pandemic years made these risks visible to every business, as shortages of components, containers and raw materials spread across industries.
Supply chain intelligence is the systematic collection and analysis of information about an organisation's suppliers, logistics routes, markets and the wider environment in which they operate, with the aim of anticipating problems and making better decisions about sourcing, inventory and recovery. This article explains why such intelligence matters, how information becomes distorted as it moves along a chain, how to map and rank risks and how to monitor them so that warning comes early enough to act.
Why supply chain intelligence matters
The costs of disruption are large. Hendricks and Singhal (2005) studied hundreds of announcements of supply chain disruptions by publicly traded firms and found that the affected companies' share prices underperformed their peers by nearly 40 per cent over the period from a year before to two years after the announcement, and that their share prices became more volatile. Disruptions were not brief embarrassments; they had lasting effects on value.
Porter (1985) described the firm as a chain of activities, each of which adds value and depends on inputs from others. Supply chains extend that chain beyond the boundaries of the firm. A company may manage its own operations well and still fail because of events several tiers upstream, at suppliers it has never heard of.
Sheffi (2005) recounts a well-known case. In 2000, a fire at a semiconductor plant in New Mexico disrupted the supply of chips to two mobile phone makers. One noticed irregularities in its incoming deliveries within days, escalated quickly and secured alternative capacity. The other responded slowly and suffered serious shortages and lost sales. The difference lay largely in how quickly each recognised the significance of the information it had, which is an intelligence problem as much as an operational one.
Information distortion: the bullwhip effect
One of the oldest findings in supply chain research is that information gets distorted as it moves upstream. Forrester (1961), in work on industrial dynamics, showed through simulation that small changes in consumer demand could produce much larger swings in orders and production further back in the chain. Sterman (1989), using a simple board game in which players manage stock at different stages of a beer distribution chain, found that even experienced managers created large oscillations because they failed to account for orders already placed but not yet delivered.
Lee et al. (1997) named this pattern the bullwhip effect and identified four causes:
- Demand signal processing. Each stage forecasts from the orders it receives rather than from final demand, and adds safety stock on top.
- Order batching. Orders placed in large, infrequent batches look like spikes to the supplier.
- Price fluctuations. Promotions and discounts encourage customers to buy ahead, distorting the pattern of orders.
- Rationing and shortage gaming. When supply is short and allocated in proportion to orders, customers inflate their orders, then cancel them when supply recovers.
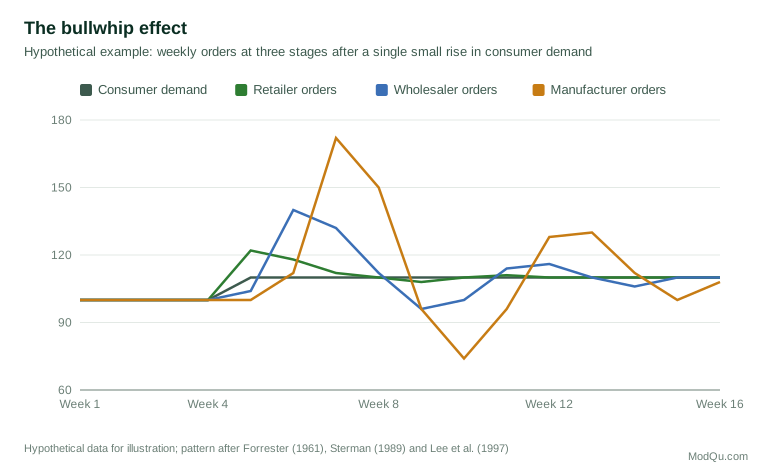
The bullwhip effect matters for intelligence because it means that the orders a firm receives are a poor guide to real demand. A manufacturer that reads a surge in orders as a surge in demand may expand capacity just as its customers' stocks are about to overflow. The remedy is to look through the orders to the underlying signal: point-of-sale data, inventory levels downstream and the plans of customers.
The value and limits of shared information
If distortion arises from each stage seeing only part of the picture, sharing information should help. Lee et al. (2000) showed through modelling that a manufacturer gains most from its retailer's demand data when demand is strongly correlated over time, highly variable and when lead times are long. Cachon and Fisher (2000), however, found that the cost savings from sharing information were modest on average in the settings they studied, and smaller than the gains from shortening lead times and reducing batch sizes. Information is valuable when it changes decisions, and when the physical system can respond to it.
Barratt and Oke (2007) distinguish between information sharing and visibility. Firms can exchange large volumes of data without gaining visibility, which requires information that is relevant, timely and trusted by those who receive it. Building visibility depends on relationships as well as systems.
Types of supply chain risk
Supply chain risks come in many forms. Chopra and Sodhi (2004) group them into categories that include:
- Disruptions: natural disasters, fires, labour disputes, supplier bankruptcy, war and terrorism.
- Delays: limited capacity or inflexibility at suppliers, congestion at ports and borders.
- Systems: failure of information systems or cyber attacks.
- Forecasts: errors due to long lead times, seasonality, short product life cycles and the bullwhip effect.
- Intellectual property: leakage of designs and know-how through outsourcing.
- Procurement: exchange rate changes and rising input prices.
- Receivables: customers unable to pay.
- Inventory: obsolescence and holding costs.
- Capacity: the cost of capacity that is too large or too small.
They emphasise that measures to reduce one risk can increase another. Holding more inventory reduces disruption risk but raises inventory risk; concentrating purchases with one supplier lowers costs but raises dependence.
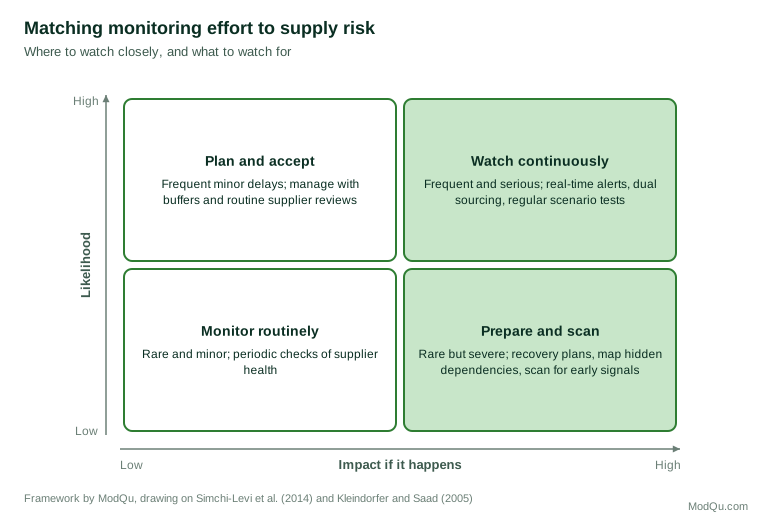
Tang (2006), in a broad review, distinguishes operational risks, the everyday uncertainties of demand, supply and cost, from disruption risks, the rarer events that can halt production. The two call for different responses. Operational risks are managed through forecasting, buffers and contracts. Disruption risks require preparation for events that may never happen.
Kleindorfer and Saad (2005) propose a sequence for managing disruption risks: specify the sources of risk and vulnerabilities, assess their likelihood and consequences, and then mitigate them through a combination of preventive and recovery measures. Intelligence contributes most to the first two steps and to the early warning that triggers recovery.
Why some disruptions are more severe
Not all disruptions have the same effect. Craighead et al. (2007) found that the severity of a disruption depends on the design of the supply chain, in particular its density (how concentrated facilities are geographically), its complexity (the number of nodes and connections) and the criticality of the affected nodes. Severity is reduced by two capabilities: recovery, the ability to restore normal operations, and warning, the ability to detect a disruption early. Warning capability is the province of intelligence.
Ivanov (2020), using simulation to study the early effects of the coronavirus pandemic on global supply chains, found that the timing of facility closures and reopenings at different stages of the chain could matter more for performance than the length of the disruption at the source. In other words, knowing when each part of the chain would stop and restart was as important as knowing how long the original outbreak would last.
Mapping and ranking risk
The first practical task of supply chain intelligence is to know the chain. Many firms know their direct suppliers well but have little knowledge of their suppliers' suppliers. Mapping beyond the first tier is laborious but often reveals concentrations of risk: several apparently independent suppliers may depend on the same sub-supplier, the same port or the same region.
Simchi-Levi et al. (2014) describe an approach developed with a major car maker. For each supplier and facility, the firm estimated the time to recover from a disruption and the effect on its own output and profits if that node stopped. The analysis showed that the suppliers posing the greatest risk were often not those with the largest purchases. Some low-cost components, with no alternative source and long recovery times, could halt entire assembly lines. Ranking suppliers by spend alone would have missed them.
Fisher (1997) adds a strategic dimension. Functional products with stable demand call for efficient supply chains that minimise cost; innovative products with unpredictable demand call for responsive supply chains that can adjust quickly. The appropriate level of monitoring, inventory and redundancy differs accordingly.
Monitoring for early warning
Once risks are mapped and ranked, the task becomes monitoring. Aguilar (1967) described environmental scanning as the acquisition of information about events and trends outside the organisation that could affect its future. Ansoff (1975) argued that strategic surprises are often preceded by weak signals: early, ambiguous indications that, if recognised, give time to respond. Gilad (2004) built on this idea to argue that early warning is the central purpose of business intelligence. In supply chains, useful signals include:
- Supplier health: late deliveries, quality problems, changes in payment terms, credit rating changes, management turnover and reports of financial strain.
- Geographic and environmental events: weather, earthquakes, floods, fires and disease outbreaks near critical facilities and routes.
- Political and regulatory change: trade restrictions, sanctions, export controls, tariffs and new regulations on materials or labour.
- Logistics conditions: port congestion, freight rates, container availability and border delays.
- Market signals: rising commodity prices, capacity announcements and changes in lead times quoted across an industry.
- Downstream demand: point-of-sale data and customer inventory, which reveal real demand behind distorted orders.
Wang et al. (2016) review how data analytics is being applied across logistics and supply chain management, from demand forecasting to supplier monitoring. Baryannis et al. (2019) survey the use of artificial intelligence in supply chain risk management, noting growing use of machine learning to predict delays and disruptions, but also the need for models whose reasoning managers can understand and trust.
Technology helps with volume, but the essential discipline is simpler: for each critical supplier and route, decide in advance which signals would indicate trouble, assign someone to watch them, and agree what action will follow when a threshold is crossed.
From intelligence to resilience
Intelligence is one part of a broader capability known as supply chain resilience. Christopher and Peck (2004) argue that resilience must be designed into the chain through flexibility, collaboration with partners, visibility and a culture of risk awareness. Ponomarov and Holcomb (2009) define it as the ability to prepare for unexpected events, respond to disruptions and recover from them. Pettit et al. (2010) describe resilience as a balance between vulnerabilities, such as dependence on single suppliers or distant sources, and capabilities, such as flexibility, spare capacity and visibility. Too few capabilities leave the firm exposed; too many waste money.
Intelligence contributes to this balance in three ways. It reveals vulnerabilities that would otherwise be hidden, such as shared sub-suppliers. It shortens the time between an event and the firm's response, which Craighead et al. (2007) show reduces severity. And it informs decisions about where to invest in redundancy, by showing which risks are most likely and most damaging.
Organising the work
Supply chain intelligence draws on knowledge spread across the organisation. Purchasing staff know suppliers and contracts; logistics staff know routes and carriers; engineers know which parts can be substituted; finance knows suppliers' payment behaviour; sales knows what customers are planning. A central team that relies only on external news feeds will miss much of this. The most effective arrangements give one small team responsibility for the overall risk picture and the monitoring system, with named contacts in each function who report concerns and receive alerts.
A regular rhythm helps. A weekly review of alerts and supplier performance deals with operational risks. A quarterly review revisits the map, the ranking of critical nodes and the thresholds for action. An annual exercise, in which managers work through a realistic disruption scenario, tests whether plans and contacts still work. Kleindorfer and Saad (2005) stress that disruption risk management must be continuous, because both the supply chain and its environment keep changing. New products bring new parts and suppliers, suppliers change their own sources, and political and climate risks shift from year to year. A map that was accurate two years ago may now hide the most important dependency, which is why the review rhythm matters as much as the initial mapping exercise.
Measuring whether monitoring works
It is hard to measure warnings that prevented a problem, but several indicators show whether the system is effective:
- Coverage: the share of critical parts and suppliers, including those beyond the first tier, that are mapped and monitored.
- Lead time of warning: how long before an event affected operations the first relevant signal was recorded, measured after each incident.
- Response time: how long it took from the first alert to an agreed action.
- False alarms: how many alerts led to no action, which shows whether thresholds are set sensibly.
- Recovery time: how long it took to restore normal supply after each disruption, compared with the estimates used in planning.
Reviewing each significant disruption, near miss and false alarm in this way turns experience into better thresholds, better maps and better plans.
Common mistakes
Several mistakes recur in supply chain risk monitoring:
- Monitoring only direct suppliers. Many serious disruptions start at the second or third tier.
- Ranking suppliers by spend. Low-cost components with no alternative source can stop production (Simchi-Levi et al., 2014).
- Reading orders as demand. The bullwhip effect means orders can mislead; look for downstream data.
- Collecting signals without thresholds. Alerts that no one is responsible for acting on produce noise, not warning.
- Planning for the last crisis. Risk registers often reflect recent events. The next disruption may come from a different direction.
- Treating resilience as purely internal. Sharing information with suppliers and customers improves visibility for all, but it requires trust and clear rules about how information will be used.
An illustration
A Canadian maker of agricultural equipment buys hydraulic components from three suppliers in different countries and believes its supply is well diversified. A mapping exercise reveals that all three buy a particular seal from the same small manufacturer, whose single plant sits in a region prone to flooding. The seal costs a few dollars, but without it no machine can be completed, and finding and qualifying a new source would take about four months.
The intelligence team adds the seal maker and its region to its monitoring list, with weather alerts, local news and the seal maker's delivery performance tracked weekly. Purchasing negotiates a safety stock of seals held by one of the hydraulic suppliers and begins qualifying a second source. Eighteen months later, heavy rains close the seal maker's plant for six weeks. The alert reaches the firm on the first day; the safety stock covers most of the gap, and the second source, by then approved, fills the rest. Competitors that had not mapped the dependency lose a season's sales.
Conclusion
Supply chain intelligence gives organisations the information they need to anticipate disruptions, see through distorted demand signals and decide where to invest in resilience. It begins with knowing the chain beyond the first tier, ranking risks by impact and recovery time rather than spend, and recognising that orders are not demand. It continues with disciplined monitoring of agreed signals, with clear thresholds and responsibilities, so that warning arrives early enough to act. Supply chains will never be free of risk, but organisations that understand their chains and watch them carefully recover faster and lose less when something goes wrong.
References
Aguilar, F. J. (1967). Scanning the business environment. Macmillan.
Ansoff, H. I. (1975). Managing strategic surprise by response to weak signals. California Management Review, 18(2), 21–33. https://doi.org/10.2307/41164635
Barratt, M., & Oke, A. (2007). Antecedents of supply chain visibility in retail supply chains: A resource-based theory perspective. Journal of Operations Management, 25(6), 1217–1233. https://doi.org/10.1016/j.jom.2007.01.003
Baryannis, G., Validi, S., Dani, S., & Antoniou, G. (2019). Supply chain risk management and artificial intelligence: State of the art and future research directions. International Journal of Production Research, 57(7), 2179–2202. https://doi.org/10.1080/00207543.2018.1530476
Cachon, G. P., & Fisher, M. (2000). Supply chain inventory management and the value of shared information. Management Science, 46(8), 1032–1048. https://doi.org/10.1287/mnsc.46.8.1032.12029
Chopra, S., & Sodhi, M. S. (2004). Managing risk to avoid supply-chain breakdown. MIT Sloan Management Review, 46(1), 53–61.
Christopher, M., & Peck, H. (2004). Building the resilient supply chain. International Journal of Logistics Management, 15(2), 1–14. https://doi.org/10.1108/09574090410700275
Craighead, C. W., Blackhurst, J., Rungtusanatham, M. J., & Handfield, R. B. (2007). The severity of supply chain disruptions: Design characteristics and mitigation capabilities. Decision Sciences, 38(1), 131–156. https://doi.org/10.1111/j.1540-5915.2007.00151.x
Fisher, M. L. (1997). What is the right supply chain for your product? Harvard Business Review, 75(2), 105–116.
Forrester, J. W. (1961). Industrial dynamics. MIT Press.
Gilad, B. (2004). Early warning: Using competitive intelligence to anticipate market shifts, control risk, and create powerful strategies. AMACOM.
Hendricks, K. B., & Singhal, V. R. (2005). An empirical analysis of the effect of supply chain disruptions on long-run stock price performance and equity risk of the firm. Production and Operations Management, 14(1), 35–52. https://doi.org/10.1111/j.1937-5956.2005.tb00008.x
Ivanov, D. (2020). Predicting the impacts of epidemic outbreaks on global supply chains: A simulation-based analysis on the coronavirus outbreak (COVID-19/SARS-CoV-2) case. Transportation Research Part E: Logistics and Transportation Review, 136, Article 101922. https://doi.org/10.1016/j.tre.2020.101922
Kleindorfer, P. R., & Saad, G. H. (2005). Managing disruption risks in supply chains. Production and Operations Management, 14(1), 53–68. https://doi.org/10.1111/j.1937-5956.2005.tb00009.x
Lee, H. L., Padmanabhan, V., & Whang, S. (1997). Information distortion in a supply chain: The bullwhip effect. Management Science, 43(4), 546–558. https://doi.org/10.1287/mnsc.43.4.546
Lee, H. L., So, K. C., & Tang, C. S. (2000). The value of information sharing in a two-level supply chain. Management Science, 46(5), 626–643. https://doi.org/10.1287/mnsc.46.5.626.12047
Pettit, T. J., Fiksel, J., & Croxton, K. L. (2010). Ensuring supply chain resilience: Development of a conceptual framework. Journal of Business Logistics, 31(1), 1–21. https://doi.org/10.1002/j.2158-1592.2010.tb00125.x
Ponomarov, S. Y., & Holcomb, M. C. (2009). Understanding the concept of supply chain resilience. International Journal of Logistics Management, 20(1), 124–143. https://doi.org/10.1108/09574090910954873
Porter, M. E. (1985). Competitive advantage: Creating and sustaining superior performance. Free Press.
Sheffi, Y. (2005). The resilient enterprise: Overcoming vulnerability for competitive advantage. MIT Press.
Simchi-Levi, D., Schmidt, W., & Wei, Y. (2014). From superstorms to factory fires: Managing unpredictable supply-chain disruptions. Harvard Business Review, 92(1/2), 96–101.
Sterman, J. D. (1989). Modeling managerial behavior: Misperceptions of feedback in a dynamic decision making experiment. Management Science, 35(3), 321–339. https://doi.org/10.1287/mnsc.35.3.321
Tang, C. S. (2006). Perspectives in supply chain risk management. International Journal of Production Economics, 103(2), 451–488. https://doi.org/10.1016/j.ijpe.2005.12.006
Wang, G., Gunasekaran, A., Ngai, E. W. T., & Papadopoulos, T. (2016). Big data analytics in logistics and supply chain management: Certain investigations for research and applications. International Journal of Production Economics, 176, 98–110. https://doi.org/10.1016/j.ijpe.2016.03.014